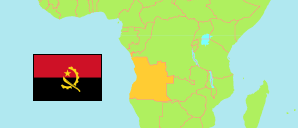
Malanje
Province in Angola
Contents: Subdivision
The population in Malanje as well as related information and services (Wikipedia, Google, images).
| Name | Status | Population Census 2014-05-16 | |
|---|---|---|---|
| Malanje | Province | 986,363 | |
| Bangâlas | Commune | 3,137 | → |
| Bange-Angola | Commune | 2,809 | → |
| Cacuso | Commune | 46,108 | → |
| Calandula | Commune | 23,871 | → |
| Cambaxe | Commune | 2,469 | → |
| Cambundi-Catembo | Commune | 23,774 | → |
| Cangandala | Commune | 32,315 | → |
| Caribo | Commune | 2,950 | → |
| Catala | Commune | 5,571 | → |
| Caxinga | Commune | 9,235 | → |
| Cuale | Commune | 15,241 | → |
| Cunda-Dia-Baze | Commune | 5,186 | → |
| Cunga-Palanca | Commune | 3,331 | → |
| Dala-Samba | Commune | 6,227 | → |
| Dombo | Commune | 7,291 | → |
| Dumba Kabango | Commune | 15,629 | → |
| Kahombo | Commune | 8,874 | → |
| Kambo Suinginge | Commune | 4,880 | → |
| Kapunda | Commune | 6,585 | → |
| Kateco-Kangola | Commune | 11,120 | → |
| Kihuhu | Commune | 7,456 | → |
| Kimbango | Commune | 12,948 | → |
| Kinge | Commune | 8,222 | → |
| Kinguengue | Commune | 11,961 | → |
| Kitapa Sede (Quitapa) | Commune | 2,845 | → |
| Kota | Commune | 21,962 | → |
| Kulamagia | Commune | 2,510 | → |
| Lemba | Commune | 2,172 | → |
| Lombe | Commune | 15,504 | → |
| Luquembo | Commune | 17,340 | → |
| Malanje | Commune | 495,882 | → |
| Marimba | Commune | 8,130 | → |
| Massango | Commune | 13,500 | → |
| Mbembo | Commune | 7,344 | → |
| Mikanda | Commune | 4,948 | → |
| Milando | Commune | 5,262 | → |
| Moma | Commune | 2,187 | → |
| Mucari (Caculama) | Commune | 12,394 | → |
| Mufuma | Commune | 5,755 | → |
| Muquixi | Commune | 2,911 | → |
| Ngola-Luige | Commune | 8,497 | → |
| Pungo-Andongo | Commune | 3,485 | → |
| Quela | Commune | 9,431 | → |
| Quirima | Commune | 13,620 | → |
| Quiuaba-N'zogi | Commune | 10,125 | → |
| Quizenga | Commune | 3,535 | → |
| Rimba | Commune | 7,387 | → |
| Sautar | Commune | 7,513 | → |
| Soqueco | Commune | 2,852 | → |
| Tala-Mungongo | Commune | 4,065 | → |
| Tembo-Aluma | Commune | 11,823 | → |
| Xandele | Commune | 6,193 | → |
| Angola | Republic | 25,789,024 |
Source: Instituto Nacional de Estatística, República de Angola (web).
Explanation: Communes in the boundaries during the 2014 census. Their area figures are derived from imprecise geometries.
Further information about the population structure:
| Gender (C 2014) | |
|---|---|
| Males | 479,788 |
| Females | 506,575 |
| Age Groups (C 2014) | |
|---|---|
| 0-14 years | 492,747 |
| 15-64 years | 464,069 |
| 65+ years | 29,546 |
| Age Distribution (C 2014) | |
|---|---|
| 0-9 years | 380,623 |
| 10-19 years | 196,961 |
| 20-29 years | 146,071 |
| 30-39 years | 97,700 |
| 40-49 years | 68,262 |
| 50-59 years | 50,370 |
| 60-69 years | 26,828 |
| 70-79 years | 13,696 |
| 80+ years | 5,851 |
| Literacy (A15+) (C 2014) | |
|---|---|
| yes | 236,990 |
| no | 256,626 |
| Religion (C 2014) | |
|---|---|
| Catholics | 361,130 |
| Protestants | 279,861 |
| Indigenous religion | 2,327 |
| Muslims | 1,877 |
| Jews | 1,904 |
| Other religion | 105,641 |
| No religion | 233,623 |
