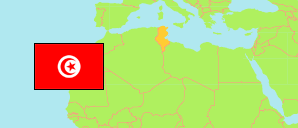
Sidi Bouzid
Governorate in Tunisia
Contents: Subdivision
The population development in Sidi Bouzid as well as related information and services (Wikipedia, Google, images).
| Name | Status | Native | Population Census 2004-04-28 | Population Census 2014-04-23 | Population Census 2024-11-06 | |
|---|---|---|---|---|---|---|
| Sidi Bouzid | Governorate | سيدي بوزيد | 395,506 | 429,912 | 489,991 | |
| Bir El Hafey | Delegation | بئر الحفي | 33,979 | 38,288 | 45,208 | → |
| Cebbala Ouled Asker [Cebalet] | Delegation | سبالة أولاد عسكر | 18,618 | 20,382 | 21,833 | → |
| El Hichria [← Sidi Bouzid Ouest / Est] | Delegation | الهيشرية | 12,414 | 13,393 | 15,114 | → |
| Essaïda [← Regueb] | Delegation | السعيدة | 21,305 | 23,175 | 27,940 | → |
| Jilma | Delegation | جلمة | 36,861 | 40,239 | 45,519 | → |
| Meknassy | Delegation | المكناسي | 22,617 | 23,789 | 21,659 | → |
| Menzel Bouzaiane | Delegation | منزل بوزيان | 23,668 | 25,321 | 31,048 | → |
| Mezzouna | Delegation | المزونة | 22,839 | 24,766 | 27,748 | → |
| Ouled Haffouz | Delegation | أولاد حفوز | 19,910 | 19,579 | 20,127 | → |
| Regueb | Delegation | الرقاب | 37,471 | 41,823 | 48,925 | → |
| Sidi Ali Ben Aoun | Delegation | سيدي علي بن عون | 24,896 | 28,214 | 31,424 | → |
| Sidi Bouzid Est | Delegation | سيدي بوزيد الشرقية | 44,449 | 45,701 | 57,961 | → |
| Sidi Bouzid Ouest | Delegation | سيدي بوزيد الغربية | 57,269 | 63,582 | 72,511 | → |
| Souk Jedid | Delegation | سوق الجديد | 19,210 | 21,660 | 22,974 | → |
| Tunisie [Tunisia] | Republic | تونس | 9,910,872 | 10,982,754 | 11,972,169 |
Source: Institut National de la Statistique Tunisie.
Explanation: Area figures are computed using geospatial data.
Further information about the population structure:
| Gender (C 2024) | |
|---|---|
| Males | 243,323 |
| Females | 246,668 |
| Age Groups (C 2024) | |
|---|---|
| 0-14 years | 125,457 |
| 15-64 years | 313,283 |
| 65+ years | 51,251 |
| Age Distribution (C 2024) | |
|---|---|
| 80+ years | 12,719 |
| 70-79 years | 20,764 |
| 60-69 years | 40,515 |
| 50-59 years | 52,546 |
| 40-49 years | 68,433 |
| 30-39 years | 72,994 |
| 20-29 years | 59,481 |
| 10-19 years | 81,184 |
| 0-9 years | 81,355 |
