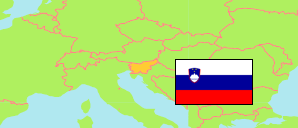
Vrhnika
Municipality in Osrednjeslovenska
Municipality
The population development of Vrhnika.
| Name | Status | Population Census 2002-03-31 | Population Census 2011-01-01 | Population Census 2021-01-01 | Population Estimate 2022-01-01 | |
|---|---|---|---|---|---|---|
| Vrhnika | Municipality | 14,373 | 16,291 | 17,613 | 17,684 | → |
| Osrednjeslovenska [Central Slovenia] | Region | 488,364 | 533,213 | 571,691 | 570,933 |
Contents: Settlements
The population development of the settlements in Vrhnika.
| Name | Status | Municipality | Population Census 2002-03-31 | Population Census 2011-01-01 | Population Census 2021-01-01 | Population Estimate 2022-01-01 | |
|---|---|---|---|---|---|---|---|
| Bevke | Settlement | Vrhnika | 791 | 929 | 991 | 1,002 | → |
| Blatna Brezovica | Settlement | Vrhnika | 328 | 347 | 341 | 356 | → |
| Drenov Grič | Settlement | Vrhnika | 761 | 914 | 987 | 1,019 | → |
| Jerinov Grič | Settlement | Vrhnika | ... | 56 | 106 | 109 | → |
| Lesno Brdo | Settlement | Vrhnika | 279 | 344 | 374 | 373 | → |
| Mala Ligojna | Settlement | Vrhnika | 120 | 152 | 216 | 213 | → |
| Mirke | Settlement | Vrhnika | 101 | 111 | 115 | 118 | → |
| Mizni Dol | Settlement | Vrhnika | ... | 147 | 261 | 264 | → |
| Podlipa | Settlement | Vrhnika | 367 | 467 | 590 | 594 | → |
| Prezid | Settlement | Vrhnika | ... | 102 | 134 | 145 | → |
| Sinja Gorica | Settlement | Vrhnika | 479 | 542 | 570 | 572 | → |
| Smrečje | Settlement | Vrhnika | 242 | 258 | 254 | 257 | → |
| Stara Vrhnika | Settlement | Vrhnika | 646 | 730 | 746 | 741 | → |
| Strmica | Settlement | Vrhnika | ... | 142 | 173 | 170 | → |
| Velika Ligojna | Settlement | Vrhnika | 323 | 391 | 428 | 434 | → |
| Verd | Settlement | Vrhnika | 1,834 | 1,891 | 1,963 | 1,952 | → |
| Vrhnika | Urban Settlement | Vrhnika | 7,520 | 8,413 | 8,889 | 8,901 | → |
| Zaplana | Settlement | Vrhnika | 439 | 114 | 159 | 148 | → |
Source: Statistical Office of the Republic of Slovenia (web).
Explanation: The 2011 and 2021 population figures are result of a register-based census.