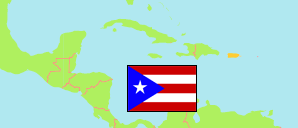
Cabo Rojo (Puerto Rico)
Municipio
The population development of Cabo Rojo.
| Name | Status | Population Census 1990-04-01 | Population Census 2000-04-01 | Population Census 2010-04-01 | Population Census 2020-04-01 | |
|---|---|---|---|---|---|---|
| Cabo Rojo | Municipio | 38,521 | 46,911 | 50,917 | 47,158 | → |
| Puerto Rico | Commonwealth | 3,522,037 | 3,808,610 | 3,726,157 | 3,193,694 |
Contents: Cities and Towns
The population development of the cities and towns in Cabo Rojo.
| Name | Status | Municipality | Population Census 1990-04-01 | Population Census 2000-04-01 | Population Census 2010-04-01 | Population Census 2020-04-01 | |
|---|---|---|---|---|---|---|---|
| Betances | Comunidad | Cabo Rojo | 1,031 | 835 | 876 | 764 | → |
| Boquerón | Comunidad | Cabo Rojo | ... | 2,017 | 2,023 | 1,964 | → |
| Cabo Rojo | Zona Urbana | Cabo Rojo | 10,131 | 10,610 | 9,803 | 8,231 | → |
| El Combate | Comunidad | Cabo Rojo | ... | ... | 423 | 357 | → |
| Monte Grande | Comunidad | Cabo Rojo | ... | 1,817 | 2,800 | 2,775 | → |
| Pole Ojea | Comunidad | Cabo Rojo | 1,539 | 1,829 | 1,695 | 1,399 | → |
| Puerto Real | Comunidad | Cabo Rojo | 3,429 | 6,166 | 5,983 | 5,383 | → |
Source: U.S. Census Bureau (web).
