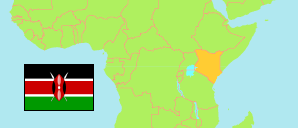
Nairobi
County in Kenya
Contents: Subdivision
The population development in Nairobi as well as related information and services (Wikipedia, Google, images).
| Name | Status | Population Census 2009-08-24 | Population Census 2019-08-24 | |
|---|---|---|---|---|
| Nairobi | County | 3,138,369 | 4,397,073 | |
| Dagoretti | Subcounty | 294,222 | 434,208 | → |
| Embakasi | Subcounty | 663,211 | 988,808 | → |
| Kamukunji | Subcounty | 220,659 | 268,276 | → |
| Kasarani | Subcounty | 525,624 | 780,656 | → |
| Kibra | Subcounty | 212,261 | 185,777 | → |
| Lang'ata | Subcounty | 178,282 | 197,489 | → |
| Makadara | Subcounty | 160,434 | 189,536 | → |
| Mathare | Subcounty | 193,416 | 206,564 | → |
| Njiru | Subcounty | 283,449 | 626,482 | → |
| Starehe | Subcounty | 159,709 | 210,423 | → |
| Westlands | Subcounty | 247,102 | 308,854 | → |
| Kenya | Republic | 38,610,097 | 47,564,296 |
Source: Kenya National Bureau of Statistics.
Further information about the population structure:
| Gender (C 2019) | |
|---|---|
| Males | 2,192,452 |
| Females | 2,204,376 |
| Intersex | 245 |
| Age Groups (C 2019) | |
|---|---|
| 0-14 years | 1,336,249 |
| 15-64 years | 3,002,314 |
| 65+ years | 58,122 |
| Age Distribution (C 2019) | |
|---|---|
| 90+ years | 1,513 |
| 80-89 years | 6,435 |
| 70-79 years | 23,791 |
| 60-69 years | 70,367 |
| 50-59 years | 190,550 |
| 40-49 years | 428,094 |
| 30-39 years | 841,266 |
| 20-29 years | 1,146,567 |
| 10-19 years | 730,403 |
| 0-9 years | 957,699 |