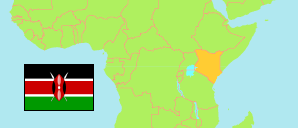
Nyamira
County in Kenya
Contents: Subdivision
The population development in Nyamira as well as related information and services (Wikipedia, Google, images).
| Name | Status | Population Census 2009-08-24 | Population Census 2019-08-24 | |
|---|---|---|---|---|
| Nyamira | County | 598,252 | 605,576 | |
| Borabu | Subcounty | 73,426 | 73,167 | → |
| Manga | Subcounty | 87,859 | 94,209 | → |
| Masaba North | Subcounty | 111,277 | 111,860 | → |
| Nyamira North | Subcounty | 166,017 | 167,267 | → |
| Nyamira South | Subcounty | 159,673 | 159,073 | → |
| Kenya | Republic | 38,610,097 | 47,564,296 |
Source: Kenya National Bureau of Statistics.
Further information about the population structure:
| Gender (C 2019) | |
|---|---|
| Males | 290,907 |
| Females | 314,656 |
| Intersex | 13 |
| Age Groups (C 2019) | |
|---|---|
| 0-14 years | 236,704 |
| 15-64 years | 338,500 |
| 65+ years | 30,355 |
| Age Distribution (C 2019) | |
|---|---|
| 90+ years | 1,382 |
| 80-89 years | 5,186 |
| 70-79 years | 12,918 |
| 60-69 years | 26,880 |
| 50-59 years | 36,215 |
| 40-49 years | 53,556 |
| 30-39 years | 76,321 |
| 20-29 years | 86,004 |
| 10-19 years | 163,886 |
| 0-9 years | 143,211 |
