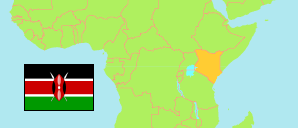
Nyanza
Former Province in Kenya
Contents: Subdivision
The population development in Nyanza as well as related information and services (Wikipedia, Google, images).
| Name | Status | Population Census 1979-08-24 | Population Census 1989-08-24 | Population Census 1999-08-24 | Population Census 2009-08-24 | Population Census 2019-08-24 | Population Projection 2023-07-01 | |
|---|---|---|---|---|---|---|---|---|
| Nyanza | Former Province | 2,643,956 | 3,507,162 | 4,392,196 | 5,442,711 | 6,269,579 | 6,776,082 | |
| Homa Bay | County | ... | ... | 751,332 | 963,794 | 1,131,950 | 1,231,659 | → |
| Kisii | County | ... | ... | 952,725 | 1,152,282 | 1,266,860 | 1,344,907 | → |
| Kisumu | County | 482,327 | 664,086 | 804,289 | 968,909 | 1,155,574 | 1,248,474 | → |
| Migori | County | ... | ... | 666,784 | 917,170 | 1,116,436 | 1,234,082 | → |
| Nyamira | County | ... | ... | 498,102 | 598,252 | 605,576 | 657,502 | → |
| Siaya | County | 474,516 | 639,439 | 718,964 | 842,304 | 993,183 | 1,059,458 | → |
| Kenya | Republic | 15,327,061 | 21,443,636 | 28,686,607 | 38,610,097 | 47,564,296 | 51,525,602 |
Source: Kenya National Bureau of Statistics.
Further information about the population structure:
| Gender (P 2023) | |
|---|---|
| Males | 3,353,260 |
| Females | 3,422,822 |
| Age Groups (P 2023) | |
|---|---|
| 0-14 years | 2,514,722 |
| 15-64 years | 3,995,420 |
| 65+ years | 265,941 |
| Age Distribution (P 2023) | |
|---|---|
| 80+ years | 68,384 |
| 70-79 years | 113,456 |
| 60-69 years | 190,769 |
| 50-59 years | 298,911 |
| 40-49 years | 568,328 |
| 30-39 years | 924,970 |
| 20-29 years | 1,325,861 |
| 10-19 years | 1,578,809 |
| 0-9 years | 1,706,595 |
| Urbanization (C 2019) | |
|---|---|
| Rural | 5,264,531 |
| Urban | 1,005,048 |
| Religion (C 2019) | |
|---|---|
| Catholic | 1,407,660 |
| Protestant | 2,291,796 |
| Evangelical | 1,317,098 |
| Other Christian | 1,039,439 |
| Islam | 40,563 |
| Hindu | 3,039 |
| Traditional | 12,855 |
| Other religion | 76,848 |
| No religion | 39,337 |