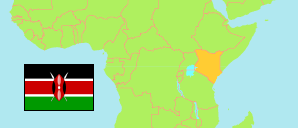
Kisii
County in Kenya
Contents: Subdivision
The population development in Kisii as well as related information and services (Wikipedia, Google, images).
| Name | Status | Population Census 2009-08-24 | Population Census 2019-08-24 | |
|---|---|---|---|---|
| Kisii | County | 1,152,282 | 1,266,860 | |
| Etago | Subcounty | 80,929 | 83,787 | → |
| Gucha | Subcounty | 75,156 | 83,740 | → |
| Gucha South | Subcounty | 78,120 | 83,623 | → |
| Kenyenya | Subcounty | 125,573 | 131,740 | → |
| Kisii Central | Subcounty | 129,745 | 166,906 | → |
| Kisii South | Subcounty | 114,615 | 135,134 | → |
| Kitutu Central | Subcounty | 132,131 | 154,175 | → |
| Marani | Subcounty | 103,869 | 107,464 | → |
| Masaba South | Subcounty | 122,070 | 122,396 | → |
| Nyamache | Subcounty | 126,262 | 130,898 | → |
| Sameta | Subcounty | 63,812 | 66,997 | → |
| Kenya | Republic | 38,610,097 | 47,564,296 |
Source: Kenya National Bureau of Statistics.
Further information about the population structure:
| Gender (C 2019) | |
|---|---|
| Males | 605,784 |
| Females | 661,038 |
| Intersex | 38 |
| Age Groups (C 2019) | |
|---|---|
| 0-14 years | 510,843 |
| 15-64 years | 698,534 |
| 65+ years | 57,423 |
| Age Distribution (C 2019) | |
|---|---|
| 90+ years | 2,638 |
| 80-89 years | 9,835 |
| 70-79 years | 23,421 |
| 60-69 years | 52,240 |
| 50-59 years | 68,123 |
| 40-49 years | 101,518 |
| 30-39 years | 154,417 |
| 20-29 years | 193,598 |
| 10-19 years | 345,553 |
| 0-9 years | 315,457 |