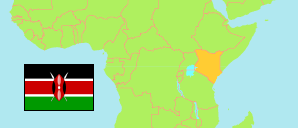
Homa Bay
County in Kenya
Contents: Subdivision
The population development in Homa Bay as well as related information and services (Wikipedia, Google, images).
| Name | Status | Population Census 2009-08-24 | Population Census 2019-08-24 | |
|---|---|---|---|---|
| Homa Bay | County | 963,794 | 1,131,950 | |
| Homa Bay | Subcounty | 90,442 | 117,439 | → |
| Ndhiwa | Subcounty | 172,212 | 218,136 | → |
| Rachuonyo East | Subcounty | 107,549 | 121,822 | → |
| Rachuonyo North | Subcounty | 162,045 | 178,686 | → |
| Rachuonyo South | Subcounty | 113,117 | 130,814 | → |
| Rangwe | Subcounty | 103,966 | 117,732 | → |
| Suba North | Subcounty | 111,409 | 124,938 | → |
| Suba South | Subcounty | 103,054 | 122,383 | → |
| Kenya | Republic | 38,610,097 | 47,564,296 |
Source: Kenya National Bureau of Statistics.
Further information about the population structure:
| Gender (C 2019) | |
|---|---|
| Males | 539,560 |
| Females | 592,367 |
| Intersex | 23 |
| Age Groups (C 2019) | |
|---|---|
| 0-14 years | 503,989 |
| 15-64 years | 578,549 |
| 65+ years | 49,380 |
| Age Distribution (C 2019) | |
|---|---|
| 90+ years | 1,720 |
| 80-89 years | 8,680 |
| 70-79 years | 21,628 |
| 60-69 years | 39,147 |
| 50-59 years | 48,076 |
| 40-49 years | 76,151 |
| 30-39 years | 124,244 |
| 20-29 years | 171,496 |
| 10-19 years | 318,121 |
| 0-9 years | 322,655 |