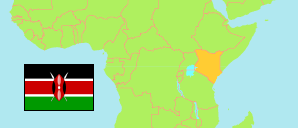
Kakamega
County in Kenya
Contents: Subdivision
The population development in Kakamega as well as related information and services (Wikipedia, Google, images).
| Name | Status | Population Census 2009-08-24 | Population Census 2019-08-24 | |
|---|---|---|---|---|
| Kakamega | County | 1,660,651 | 1,867,579 | |
| Butere | Subcounty | 139,780 | 154,100 | → |
| Kakamega Central | Subcounty | 160,229 | 188,212 | → |
| Kakamega East | Subcounty | 159,475 | 167,641 | → |
| Kakamega North | Subcounty | 205,166 | 238,330 | → |
| Kakamega South | Subcounty | 104,669 | 111,743 | → |
| Khwisero | Subcounty | 102,635 | 113,476 | → |
| Likuyani | Subcounty | 125,137 | 152,055 | → |
| Lugari | Subcounty | 106,123 | 122,728 | → |
| Matete | Subcounty | 60,891 | 66,172 | → |
| Matungu | Subcounty | 146,563 | 166,940 | → |
| Mumias East | Subcounty | 100,956 | 116,851 | → |
| Mumias West | Subcounty | 111,862 | 115,354 | → |
| Navakholo | Subcounty | 137,165 | 153,977 | → |
| Kenya | Republic | 38,610,097 | 47,564,296 |
Source: Kenya National Bureau of Statistics.
Further information about the population structure:
| Gender (C 2019) | |
|---|---|
| Males | 897,133 |
| Females | 970,406 |
| Intersex | 40 |
| Age Groups (C 2019) | |
|---|---|
| 0-14 years | 786,681 |
| 15-64 years | 994,955 |
| 65+ years | 85,872 |
| Age Distribution (C 2019) | |
|---|---|
| 90+ years | 2,788 |
| 80-89 years | 14,538 |
| 70-79 years | 36,892 |
| 60-69 years | 74,032 |
| 50-59 years | 104,028 |
| 40-49 years | 144,719 |
| 30-39 years | 201,262 |
| 20-29 years | 263,897 |
| 10-19 years | 530,648 |
| 0-9 years | 494,704 |
