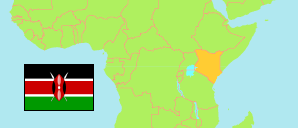
Narok
County in Kenya
Contents: Subdivision
The population development in Narok as well as related information and services (Wikipedia, Google, images).
| Name | Status | Population Census 2009-08-24 | Population Census 2019-08-24 | |
|---|---|---|---|---|
| Narok | County | 850,920 | 1,157,873 | |
| Narok East | Subcounty | 79,147 | 115,323 | → |
| Narok North (incl. Mau Forest) | Subcounty | 188,142 | 251,894 | → |
| Narok South | Subcounty | 183,442 | 238,472 | → |
| Narok West | Subcounty | 125,657 | 195,287 | → |
| Trans Mara East | Subcounty | 92,183 | 111,183 | → |
| Trans Mara West | Subcounty | 182,349 | 245,714 | → |
| Kenya | Republic | 38,610,097 | 47,564,296 |
Source: Kenya National Bureau of Statistics.
Further information about the population structure:
| Gender (C 2019) | |
|---|---|
| Males | 579,042 |
| Females | 578,805 |
| Intersex | 26 |
| Age Groups (C 2019) | |
|---|---|
| 0-14 years | 566,350 |
| 15-64 years | 563,430 |
| 65+ years | 28,056 |
| Age Distribution (C 2019) | |
|---|---|
| 90+ years | 1,602 |
| 80-89 years | 4,543 |
| 70-79 years | 12,268 |
| 60-69 years | 24,016 |
| 50-59 years | 41,855 |
| 40-49 years | 76,822 |
| 30-39 years | 121,989 |
| 20-29 years | 183,568 |
| 10-19 years | 304,240 |
| 0-9 years | 386,933 |
