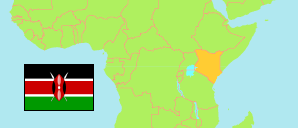
Rift Valley
Former Province in Kenya
Contents: Subdivision
The population development in Rift Valley as well as related information and services (Wikipedia, Google, images).
| Name | Status | Population Census 1979-08-24 | Population Census 1989-08-24 | Population Census 1999-08-24 | Population Census 2009-08-24 | Population Census 2019-08-24 | Population Projection 2023-07-01 | |
|---|---|---|---|---|---|---|---|---|
| Rift Valley | Former Province | 3,240,402 | 4,981,613 | 6,987,036 | 10,006,805 | 12,752,966 | 13,909,992 | |
| Baringo | County | 203,792 | 347,990 | 403,141 | 555,561 | 666,763 | 733,333 | → |
| Bomet | County | ... | ... | ... | 730,129 | 875,689 | 939,761 | → |
| Elgeyo-Marakwet | County | 148,868 | 216,487 | 284,494 | 369,998 | 454,480 | 495,239 | → |
| Kajiado | County | 149,005 | 258,659 | 406,054 | 687,312 | 1,117,840 | 1,268,261 | → |
| Kericho | County | ... | ... | ... | 752,396 | 901,777 | 954,896 | → |
| Laikipia | County | 134,524 | 218,957 | 322,187 | 399,227 | 518,560 | 561,223 | → |
| Nakuru | County | 522,709 | 849,096 | 1,187,039 | 1,603,325 | 2,162,202 | 2,347,849 | → |
| Nandi | County | 299,319 | 433,613 | 578,751 | 752,965 | 885,711 | 951,460 | → |
| Narok | County | 210,306 | 398,272 | 536,341 | 850,920 | 1,157,873 | 1,284,204 | → |
| Samburu | County | 76,908 | 108,884 | 143,547 | 223,947 | 310,327 | 348,298 | → |
| Trans Nzoia | County | 259,503 | 393,682 | 575,662 | 818,757 | 990,341 | 1,069,039 | → |
| Turkana | County | 142,702 | 184,060 | 450,860 | 855,399 | 926,976 | 1,022,773 | → |
| Uasin Gishu | County | 300,766 | 445,530 | 622,705 | 894,179 | 1,163,186 | 1,257,330 | → |
| West Pokot | County | 158,652 | 225,449 | 308,086 | 512,690 | 621,241 | 676,326 | → |
| Kenya | Republic | 15,327,061 | 21,443,636 | 28,686,607 | 38,610,097 | 47,564,296 | 51,525,602 |
Source: Kenya National Bureau of Statistics.
Further information about the population structure:
| Gender (P 2023) | |
|---|---|
| Males | 6,874,427 |
| Females | 7,035,569 |
| Age Groups (P 2023) | |
|---|---|
| 0-14 years | 5,230,793 |
| 15-64 years | 8,234,236 |
| 65+ years | 444,961 |
| Age Distribution (P 2023) | |
|---|---|
| 80+ years | 111,571 |
| 70-79 years | 193,066 |
| 60-69 years | 329,148 |
| 50-59 years | 599,012 |
| 40-49 years | 1,175,359 |
| 30-39 years | 1,890,455 |
| 20-29 years | 2,769,064 |
| 10-19 years | 3,301,734 |
| 0-9 years | 3,540,581 |
| Urbanization (C 2019) | |
|---|---|
| Rural | 9,669,993 |
| Urban | 3,082,973 |
| Religion (C 2019) | |
|---|---|
| Catholic | 2,883,836 |
| Protestant | 4,778,111 |
| Evangelical | 2,879,033 |
| Other Christian | 1,316,797 |
| Islam | 146,074 |
| Hindu | 5,511 |
| Traditional | 155,866 |
| Other religion | 157,916 |
| No religion | 309,087 |