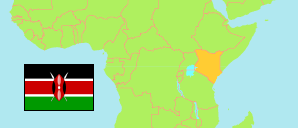
Kwale
County in Kenya
Contents: Subdivision
The population development in Kwale as well as related information and services (Wikipedia, Google, images).
| Name | Status | Population Census 2009-08-24 | Population Census 2019-08-24 | |
|---|---|---|---|---|
| Kwale | County | 649,931 | 866,820 | |
| Kinango | Subcounty | 61,195 | 94,220 | → |
| Lunga Lunga | Subcounty | 153,354 | 198,423 | → |
| Matuga | Subcounty | 150,634 | 194,252 | → |
| Msambweni | Subcounty | 136,383 | 177,690 | → |
| Samburu-Kwale | Subcounty | 148,365 | 202,235 | → |
| Kenya | Republic | 38,610,097 | 47,564,296 |
Source: Kenya National Bureau of Statistics.
Further information about the population structure:
| Gender (C 2019) | |
|---|---|
| Males | 425,121 |
| Females | 441,681 |
| Intersex | 18 |
| Age Groups (C 2019) | |
|---|---|
| 0-14 years | 387,321 |
| 15-64 years | 446,434 |
| 65+ years | 33,035 |
| Age Distribution (C 2019) | |
|---|---|
| 90+ years | 1,265 |
| 80-89 years | 4,864 |
| 70-79 years | 14,053 |
| 60-69 years | 29,818 |
| 50-59 years | 36,265 |
| 40-49 years | 66,348 |
| 30-39 years | 95,267 |
| 20-29 years | 134,485 |
| 10-19 years | 222,393 |
| 0-9 years | 262,032 |
