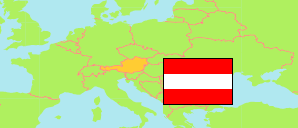
Lebring-Sankt Margarethen
in Leibnitz (Steiermark)
Contents: Commune
The population development of Lebring-Sankt Margarethen as well as related information and services (weather, Wikipedia, Google, images).
| Name | District | Population Census 1981-05-12 | Population Census 1991-05-15 | Population Census 2001-05-15 | Population Census 2011-10-31 | Population Census 2021-10-31 | Population Estimate 2025-01-01 | |
|---|---|---|---|---|---|---|---|---|
| Lebring-Sankt Margarethen | Leibnitz | 1,632 | 1,810 | 1,919 | 2,003 | 2,185 | 2,260 | → |
Source: Statistik Austria.
Explanation: 2025 population figures are final estimates.
Further information about the population structure:
| Gender (E 2025) | |
|---|---|
| Males | 1,097 |
| Females | 1,163 |
| Age Groups (E 2025) | |
|---|---|
| 0-17 years | 391 |
| 18-64 years | 1,410 |
| 65+ years | 459 |
| Age Distribution (E 2025) | |
|---|---|
| 90+ years | 15 |
| 80-89 years | 102 |
| 70-79 years | 203 |
| 60-69 years | 342 |
| 50-59 years | 379 |
| 40-49 years | 297 |
| 30-39 years | 308 |
| 20-29 years | 184 |
| 10-19 years | 209 |
| 0-9 years | 221 |
| Citizenship (E 2025) | |
|---|---|
| Austria | 1,988 |
| EU, EFTA, UK | 230 |
| Other Citizenship | 42 |
| Country of Birth (E 2025) | |
|---|---|
| Austria | 1,969 |
| EU, EFTA, UK | 231 |
| Other country | 60 |
