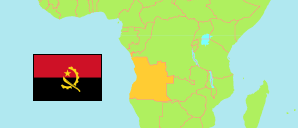
Cunene
Province in Angola
Contents: Subdivision
The population in Cunene as well as related information and services (Wikipedia, Google, images).
| Name | Status | Population Census 2014-05-16 | |
|---|---|---|---|
| Cunene | Province | 990,087 | |
| Cafima-Nehone | Commune | 50,229 | → |
| Cahama | Commune | 40,766 | → |
| Chitado | Commune | 23,163 | → |
| Curoca (Onkokwa) | Commune | 17,923 | → |
| Evale | Commune | 55,386 | → |
| Humbe | Commune | 35,985 | → |
| Kalonga | Commune | 8,619 | → |
| Kuvati (Kubati) | Commune | 3,774 | → |
| Melunga Chiede | Commune | 55,747 | → |
| Môngua | Commune | 75,811 | → |
| Mucope (Mucoma) | Commune | 78,225 | → |
| Namacunde | Commune | 86,299 | → |
| Naulila | Commune | 60,854 | → |
| Ombala-yo-Mungu | Commune | 59,331 | → |
| Omukolongonjo (Cuvelai) | Commune | 24,324 | → |
| Omunda (Mupa) | Commune | 20,681 | → |
| Ondjiva | Commune | 187,914 | → |
| Otchinjau | Commune | 29,296 | → |
| Tchimporo-Yonde (Oximolo) | Commune | 5,189 | → |
| Xangongo | Commune | 70,568 | → |
| Angola | Republic | 25,789,024 |
Source: Instituto Nacional de Estatística, República de Angola (web).
Explanation: Communes in the boundaries during the 2014 census. Their area figures are derived from imprecise geometries.
Further information about the population structure:
| Gender (C 2014) | |
|---|---|
| Males | 462,056 |
| Females | 528,031 |
| Age Groups (C 2014) | |
|---|---|
| 0-14 years | 473,424 |
| 15-64 years | 480,006 |
| 65+ years | 36,656 |
| Age Distribution (C 2014) | |
|---|---|
| 0-9 years | 357,337 |
| 10-19 years | 214,029 |
| 20-29 years | 158,332 |
| 30-39 years | 100,985 |
| 40-49 years | 64,565 |
| 50-59 years | 43,298 |
| 60-69 years | 24,864 |
| 70-79 years | 16,356 |
| 80+ years | 10,320 |
| Literacy (A15+) (C 2014) | |
|---|---|
| yes | 277,847 |
| no | 238,815 |
| Religion (C 2014) | |
|---|---|
| Catholics | 655,904 |
| Protestants | 198,221 |
| Indigenous religion | 340 |
| Muslims | 1,046 |
| Jews | 1,501 |
| Other religion | 31,430 |
| No religion | 101,645 |
