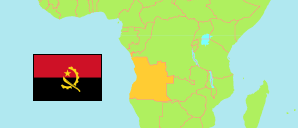
Huíla
Province in Angola
Contents: Subdivision
The population in Huíla as well as related information and services (Wikipedia, Google, images).
| Name | Status | Population Census 2014-05-16 | |
|---|---|---|---|
| Huíla | Province | 2,497,422 | |
| Arimba | Commune | 46,084 | → |
| Bambi | Commune | 14,760 | → |
| Bata-Bata | Commune | 9,073 | → |
| Bunjei | Commune | 16,801 | → |
| Caconda | Commune | 59,685 | → |
| Cacula | Commune | 34,429 | → |
| Cainda | Commune | 32,165 | → |
| Calépi | Commune | 30,700 | → |
| Caluquembe | Commune | 96,099 | → |
| Capelongo | Commune | 49,447 | → |
| Capunda Cavilongo | Commune | 66,337 | → |
| Chibia | Commune | 74,331 | → |
| Chicomba | Commune | 28,939 | → |
| Chicuaqueia (Tchipungo) | Commune | 33,265 | → |
| Chicungo | Commune | 11,172 | → |
| Chimbemba | Commune | 38,839 | → |
| Chipindo | Commune | 33,153 | → |
| Cusse | Commune | 46,725 | → |
| Cuvango | Commune | 36,317 | → |
| Dinde | Commune | 20,102 | → |
| Dongo | Commune | 43,756 | → |
| Galangue | Commune | 34,238 | → |
| Gambos (Chiange) | Commune | 40,623 | → |
| Gungui | Commune | 23,457 | → |
| Hoque | Commune | 64,475 | → |
| Huíla | Commune | 60,278 | → |
| Humpata | Commune | 35,688 | → |
| Impulo | Commune | 15,721 | → |
| Jamba | Commune | 35,023 | → |
| Jau | Commune | 25,186 | → |
| Kaholo | Commune | 11,638 | → |
| Kutenda (Chitenda) | Commune | 40,847 | → |
| Libongue | Commune | 6,338 | → |
| Lubango | Commune | 581,180 | → |
| Matala | Commune | 141,159 | → |
| Micosse | Commune | 47,335 | → |
| Mulondo | Commune | 24,822 | → |
| Neves | Commune | 12,332 | → |
| N'gola | Commune | 53,132 | → |
| Ombo | Commune | 28,388 | → |
| Palanca | Commune | 20,414 | → |
| Quê | Commune | 55,683 | → |
| Quihita | Commune | 24,817 | → |
| Quilenda | Commune | 24,232 | → |
| Quilengues | Commune | 39,511 | → |
| Quipungo | Commune | 56,657 | → |
| Tchamutete (Cassinga) | Commune | 26,310 | → |
| Tchiconco | Commune | 30,536 | → |
| Tchituto (N'gola) | Commune | 38,875 | → |
| Uaba | Commune | 37,953 | → |
| Vicungo | Commune | 7,989 | → |
| Vite-Vivar (Kilengue) | Commune | 30,409 | → |
| Angola | Republic | 25,789,024 |
Source: Instituto Nacional de Estatística, República de Angola (web).
Explanation: Communes in the boundaries during the 2014 census. Their area figures are derived from imprecise geometries.
Further information about the population structure:
| Gender (C 2014) | |
|---|---|
| Males | 1,186,589 |
| Females | 1,310,833 |
| Age Groups (C 2014) | |
|---|---|
| 0-14 years | 1,242,459 |
| 15-64 years | 1,186,773 |
| 65+ years | 68,190 |
| Age Distribution (C 2014) | |
|---|---|
| 0-9 years | 936,306 |
| 10-19 years | 542,761 |
| 20-29 years | 372,988 |
| 30-39 years | 253,231 |
| 40-49 years | 175,067 |
| 50-59 years | 113,267 |
| 60-69 years | 58,472 |
| 70-79 years | 30,106 |
| 80+ years | 15,225 |
| Literacy (A15+) (C 2014) | |
|---|---|
| yes | 639,132 |
| no | 615,831 |
| Religion (C 2014) | |
|---|---|
| Catholic | 1,514,164 |
| Protestant | 630,450 |
| Indigenous religion | 2,538 |
| Muslim | 2,190 |
| Jew | 5,952 |
| Other religion | 68,403 |
| No religion | 273,726 |