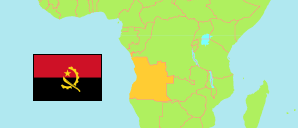
Namibe
Province in Angola
Contents: Subdivision
The population in Namibe as well as related information and services (Wikipedia, Google, images).
| Name | Status | Population Census 2014-05-16 | |
|---|---|---|---|
| Namibe | Province | 495,326 | |
| Bentiaba | Commune | 8,952 | → |
| Bibala | Commune | 25,416 | → |
| Cainde | Commune | 17,348 | → |
| Caitou | Commune | 10,486 | → |
| Camucuio | Commune | 41,449 | → |
| Chingo | Commune | 3,493 | → |
| Iona | Commune | 3,170 | → |
| Kapangombe (Munhino) | Commune | 14,316 | → |
| Lola | Commune | 14,286 | → |
| Lucira | Commune | 10,986 | → |
| Mamúe (Chinquite) | Commune | 5,407 | → |
| Namibe (Moçâmedes) | Commune | 272,598 | → |
| Tômbwa | Commune | 52,324 | → |
| Virei | Commune | 15,097 | → |
| Angola | Republic | 25,789,024 |
Source: Instituto Nacional de Estatística, República de Angola (web).
Explanation: Communes in the boundaries during the 2014 census. Their area figures are derived from imprecise geometries.
Further information about the population structure:
| Gender (C 2014) | |
|---|---|
| Males | 240,144 |
| Females | 255,182 |
| Age Groups (C 2014) | |
|---|---|
| 0-14 years | 238,763 |
| 15-64 years | 246,207 |
| 65+ years | 10,357 |
| Age Distribution (C 2014) | |
|---|---|
| 0-9 years | 175,584 |
| 10-19 years | 114,890 |
| 20-29 years | 84,597 |
| 30-39 years | 50,753 |
| 40-49 years | 32,617 |
| 50-59 years | 21,077 |
| 60-69 years | 8,831 |
| 70-79 years | 4,284 |
| 80+ years | 2,692 |
| Literacy (A15+) (C 2014) | |
|---|---|
| yes | 164,980 |
| no | 91,584 |
| Religion (C 2014) | |
|---|---|
| Catholics | 201,297 |
| Protestants | 141,010 |
| Indigenous religion | 280 |
| Muslims | 252 |
| Jews | 800 |
| Other religion | 11,962 |
| No religion | 139,725 |
