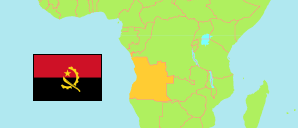
Benguela
Province in Angola
Contents: Subdivision
The population in Benguela as well as related information and services (Wikipedia, Google, images).
| Name | Status | Population Census 2014-05-16 | |
|---|---|---|---|
| Benguela | Province | 2,231,385 | |
| Babaera | Commune | 27,044 | → |
| Baía Farta | Commune | 61,572 | → |
| Balombo | Commune | 47,806 | → |
| Benguela | Commune | 561,775 | → |
| Biópio | Commune | 5,488 | → |
| Bocoio | Commune | 63,438 | → |
| Bolonguera | Commune | 9,726 | → |
| Caimbambo | Commune | 35,654 | → |
| Calahanga | Commune | 3,082 | → |
| Canhamela | Commune | 19,754 | → |
| Canjala | Commune | 13,684 | → |
| Capupa | Commune | 63,440 | → |
| Casseque | Commune | 46,087 | → |
| Catengue | Commune | 15,347 | → |
| Catumbela | Commune | 95,034 | → |
| Cayavi | Commune | 3,101 | → |
| Chicuma | Commune | 44,762 | → |
| Chila | Commune | 17,666 | → |
| Chindumbo | Commune | 26,374 | → |
| Chingongo | Commune | 20,619 | → |
| Chongoroi | Commune | 67,539 | → |
| Cubal | Commune | 166,783 | → |
| Cubal do Lumbo (Cavimbe) | Commune | 30,788 | → |
| Dombe Grande | Commune | 41,434 | → |
| Ebanga | Commune | 23,984 | → |
| Egipto Praia | Commune | 13,198 | → |
| Equimina | Commune | 1,752 | → |
| Gama | Commune | 66,202 | → |
| Ganda | Commune | 93,609 | → |
| Kamuine | Commune | 10,014 | → |
| Lobito | Commune | 366,198 | → |
| Maka-Mombolo | Commune | 14,166 | → |
| Monte Belo | Commune | 37,947 | → |
| Passe | Commune | 14,846 | → |
| Praia Bebe | Commune | 9,082 | → |
| Tumbulo (Lomaum, Quendo) | Commune | 24,262 | → |
| Wyangombe | Commune | 16,983 | → |
| Yambala | Commune | 51,147 | → |
| Angola | Republic | 25,789,024 |
Source: Instituto Nacional de Estatística, República de Angola (web).
Explanation: Communes in the boundaries during the 2014 census. Their area figures are derived from imprecise geometries.
Further information about the population structure:
| Gender (C 2014) | |
|---|---|
| Males | 1,055,819 |
| Females | 1,175,566 |
| Age Groups (C 2014) | |
|---|---|
| 0-14 years | 1,071,842 |
| 15-64 years | 1,101,874 |
| 65+ years | 57,668 |
| Age Distribution (C 2014) | |
|---|---|
| 0-9 years | 807,045 |
| 10-19 years | 485,168 |
| 20-29 years | 332,239 |
| 30-39 years | 226,043 |
| 40-49 years | 174,136 |
| 50-59 years | 114,687 |
| 60-69 years | 56,118 |
| 70-79 years | 25,471 |
| 80+ years | 10,477 |
| Literacy (A15+) (C 2014) | |
|---|---|
| yes | 733,450 |
| no | 426,093 |
| Religion (C 2014) | |
|---|---|
| Catholics | 1,552,690 |
| Protestants | 538,738 |
| Indigenous religion | 1,363 |
| Muslims | 1,768 |
| Jews | 3,567 |
| Other religion | 36,716 |
| No religion | 96,543 |
