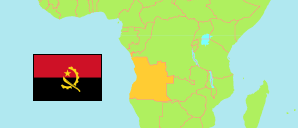
Cuanza Sul
Province in Angola
Contents: Subdivision
The population in Cuanza Sul as well as related information and services (Wikipedia, Google, images).
| Name | Status | Population Census 2014-05-16 | |
|---|---|---|---|
| Cuanza Sul | Province | 1,881,873 | |
| Amboiva | Commune | 51,682 | → |
| Assango | Commune | 57,721 | → |
| Atôme | Commune | 11,455 | → |
| Botera (Catanda) | Commune | 20,686 | → |
| Calulo | Commune | 60,709 | → |
| Cassange | Commune | 32,062 | → |
| Cassongue | Commune | 44,991 | → |
| Cela (Waku Kungo) | Commune | 150,593 | → |
| Conda | Commune | 50,887 | → |
| Condé | Commune | 59,585 | → |
| Cunjo | Commune | 38,593 | → |
| Dumbi | Commune | 38,441 | → |
| Ebo | Commune | 73,482 | → |
| Gabela Sede | Commune | 184,723 | → |
| Gungo | Commune | 33,969 | → |
| Kabuta | Commune | 14,023 | → |
| Kapolo | Commune | 16,457 | → |
| Kariango | Commune | 13,534 | → |
| Kicombo | Commune | 12,839 | → |
| Kienha | Commune | 2,475 | → |
| Kissanga Kungo | Commune | 46,563 | → |
| Kissongo | Commune | 5,257 | → |
| Lonhe | Commune | 13,389 | → |
| Munenga | Commune | 12,081 | → |
| Mussende | Commune | 63,767 | → |
| Ndala Kachibo | Commune | 14,371 | → |
| Ngangula | Commune | 23,626 | → |
| Pambangala | Commune | 57,030 | → |
| Porto Amboim | Commune | 109,512 | → |
| Quibala | Commune | 100,764 | → |
| Quilenda | Commune | 81,655 | → |
| Quirimbo | Commune | 15,993 | → |
| Sanga | Commune | 28,364 | → |
| São Lucas | Commune | 16,303 | → |
| Sumbe Sede | Commune | 209,534 | → |
| Uku-Seles | Commune | 114,760 | → |
| Angola | Republic | 25,789,024 |
Source: Instituto Nacional de Estatística, República de Angola (web).
Explanation: Communes in the boundaries during the 2014 census. Their area figures are derived from imprecise geometries.
Further information about the population structure:
| Gender (C 2014) | |
|---|---|
| Males | 905,809 |
| Females | 976,064 |
| Age Groups (C 2014) | |
|---|---|
| 0-14 years | 920,448 |
| 15-64 years | 905,564 |
| 65+ years | 55,861 |
| Age Distribution (C 2014) | |
|---|---|
| 0-9 years | 707,315 |
| 10-19 years | 398,967 |
| 20-29 years | 264,425 |
| 30-39 years | 186,694 |
| 40-49 years | 139,679 |
| 50-59 years | 97,207 |
| 60-69 years | 50,529 |
| 70-79 years | 25,409 |
| 80+ years | 11,647 |
| Literacy (A15+) (C 2014) | |
|---|---|
| yes | 529,591 |
| no | 431,835 |
| Religion (C 2014) | |
|---|---|
| Catholics | 511,896 |
| Protestants | 617,902 |
| Indigenous religion | 1,131 |
| Muslims | 1,913 |
| Jews | 2,664 |
| Other religion | 43,639 |
| No religion | 702,728 |
