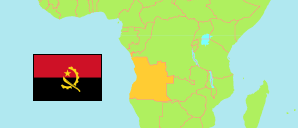
Cuanza Norte
Province in Angola
Contents: Subdivision
The population in Cuanza Norte as well as related information and services (Wikipedia, Google, images).
| Name | Status | Population Census 2014-05-16 | |
|---|---|---|---|
| Cuanza Norte | Province | 443,386 | |
| Aldeia Nova | Commune | 2,665 | → |
| Ambaca (Camabatela) | Commune | 24,322 | → |
| Banga | Commune | 4,011 | → |
| Bindo | Commune | 3,847 | → |
| Bolongongo | Commune | 8,478 | → |
| Caculo Cabaça | Commune | 2,016 | → |
| Camame | Commune | 2,019 | → |
| Cambondo | Commune | 2,165 | → |
| Canhoca (Caculo) | Commune | 2,910 | → |
| Cariamba | Commune | 1,662 | → |
| Cavunga | Commune | 495 | → |
| Cêrca | Commune | 4,005 | → |
| Dange-ya-Menha | Commune | 1,482 | → |
| Dondo | Commune | 71,715 | → |
| Golungo Alto | Commune | 23,819 | → |
| Kiangombe | Commune | 931 | → |
| Kiculungo | Commune | 9,732 | → |
| Kiluange | Commune | 3,845 | → |
| Kiquiemba | Commune | 2,154 | → |
| Lucala | Commune | 21,743 | → |
| Luinga | Commune | 15,103 | → |
| Massangano | Commune | 10,557 | → |
| Maúa | Commune | 7,639 | → |
| N'dalatando | Commune | 168,832 | → |
| Quilombo dos Dembos (Ngonguembo) | Commune | 5,061 | → |
| Samba Cajú | Commune | 17,508 | → |
| Samba Lucala | Commune | 4,410 | → |
| São Pedro da Quilemba | Commune | 2,506 | → |
| Tango | Commune | 10,858 | → |
| Terreiro | Commune | 2,388 | → |
| Zenza do Itombe | Commune | 4,507 | → |
| Angola | Republic | 25,789,024 |
Source: Instituto Nacional de Estatística, República de Angola (web).
Explanation: Communes in the boundaries during the 2014 census. Their area figures are derived from imprecise geometries.
Further information about the population structure:
| Gender (C 2014) | |
|---|---|
| Males | 217,060 |
| Females | 226,326 |
| Age Groups (C 2014) | |
|---|---|
| 0-14 years | 214,483 |
| 15-64 years | 215,564 |
| 65+ years | 13,339 |
| Age Distribution (C 2014) | |
|---|---|
| 0-9 years | 162,797 |
| 10-19 years | 92,267 |
| 20-29 years | 66,057 |
| 30-39 years | 44,888 |
| 40-49 years | 32,557 |
| 50-59 years | 23,668 |
| 60-69 years | 12,791 |
| 70-79 years | 6,245 |
| 80+ years | 2,116 |
| Literacy (A15+) (C 2014) | |
|---|---|
| yes | 140,915 |
| no | 87,988 |
| Religion (C 2014) | |
|---|---|
| Catholics | 262,772 |
| Protestants | 94,106 |
| Indigenous religion | 108 |
| Muslims | 421 |
| Jews | 1,014 |
| Other religion | 11,865 |
| No religion | 73,099 |
