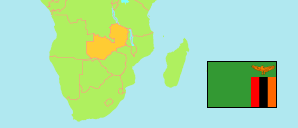
Kasama
District in Zambia
Contents: Subdivision
The population in Kasama as well as related information and services (Wikipedia, Google, images).
| Name | Status | Population Census 2010-10-16 | |
|---|---|---|---|
| Kasama | District | 231,824 | |
| Bululu | Ward | 18,968 | → |
| Buseko | Ward | 63,911 | → |
| Chiba | Ward | 7,818 | → |
| Chibundu | Ward | 9,095 | → |
| Chilunga | Ward | 12,147 | → |
| Chumba | Ward | 5,041 | → |
| Julia Chikamoneka | Ward | 2,780 | → |
| Kapongolo | Ward | 6,726 | → |
| Kapumaula | Ward | 9,812 | → |
| Kasenga | Ward | 12,501 | → |
| Lualuo | Ward | 8,569 | → |
| Lukulu | Ward | 3,874 | → |
| Lukupa | Ward | 9,437 | → |
| Lusenga | Ward | 11,029 | → |
| Mukanga | Ward | 7,881 | → |
| Mulilansolo | Ward | 36,470 | → |
| Musowa | Ward | 5,765 | → |
| Zambia | Republic | 13,092,666 |
Source: Central Statistical Office Zambia (web).
Explanation: Districts in the boundaries of 2016 and wards in the the boundaries of 2010; slight deviations from the actual situation are possible. Area figures are computed by using geospatial data.
Further information about the population structure:
| Gender (C 2010) | |
|---|---|
| Males | 114,208 |
| Females | 117,616 |
| Age Groups (C 2010) | |
|---|---|
| 0-14 years | 107,872 |
| 15-64 years | 116,914 |
| 65+ years | 7,038 |
| Age Distribution (C 2010) | |
|---|---|
| 0-9 years | 75,339 |
| 10-19 years | 59,941 |
| 20-29 years | 37,707 |
| 30-39 years | 25,182 |
| 40-49 years | 14,624 |
| 50-59 years | 8,719 |
| 60+ years | 10,312 |
| Urbanization (C 2010) | |
|---|---|
| Rural | 129,979 |
| Urban | 101,845 |