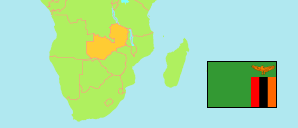
Lusaka
District in Zambia
Contents: Subdivision
The population in Lusaka as well as related information and services (Wikipedia, Google, images).
| Name | Status | Population Census 2010-10-16 | |
|---|---|---|---|
| Lusaka | District | 1,747,152 | |
| Chainda | Ward | 38,393 | → |
| Chaisa | Ward | 19,858 | → |
| Chakunkula | Ward | 32,382 | → |
| Chawama | Ward | 70,181 | → |
| Chilenje | Ward | 52,220 | → |
| Harry Mwaanga Nkumbula | Ward | 167,542 | → |
| Independence | Ward | 16,134 | → |
| John Howard | Ward | 28,900 | → |
| Justine Kabwe | Ward | 40,373 | → |
| Kabulonga | Ward | 57,904 | → |
| Kabwata | Ward | 22,537 | → |
| Kalingalinga | Ward | 39,139 | → |
| Kamulanga | Ward | 25,935 | → |
| Kamwala | Ward | 51,299 | → |
| Kanyama | Ward | 169,253 | → |
| Kapwepwe | Ward | 54,650 | → |
| Libala | Ward | 22,347 | → |
| Lilayi | Ward | 13,402 | → |
| Lima | Ward | 62,592 | → |
| Lubwa | Ward | 36,445 | → |
| Matero | Ward | 55,629 | → |
| Mpulungu | Ward | 57,596 | → |
| Mtendere | Ward | 106,128 | → |
| Muchinga | Ward | 40,985 | → |
| Mulungushi | Ward | 13,224 | → |
| Munali | Ward | 45,933 | → |
| Munkolo | Ward | 27,860 | → |
| Mwembeshi | Ward | 68,878 | → |
| Ngwerere | Ward | 66,205 | → |
| Nkoloma | Ward | 75,082 | → |
| Raphael Chota | Ward | 95,041 | → |
| Roma | Ward | 66,491 | → |
| Silwizya | Ward | 6,614 | → |
| Zambia | Republic | 13,092,666 |
Source: Central Statistical Office Zambia (web).
Explanation: Districts in the boundaries of 2016 and wards in the the boundaries of 2010; slight deviations from the actual situation are possible. Area figures are computed by using geospatial data.
Further information about the population structure:
| Gender (C 2010) | |
|---|---|
| Males | 860,424 |
| Females | 886,728 |
| Age Groups (C 2010) | |
|---|---|
| 0-14 years | 690,140 |
| 15-64 years | 1,033,633 |
| 65+ years | 23,379 |
| Age Distribution (C 2010) | |
|---|---|
| 0-9 years | 475,703 |
| 10-19 years | 418,386 |
| 20-29 years | 376,003 |
| 30-39 years | 265,610 |
| 40-49 years | 118,279 |
| 50-59 years | 54,442 |
| 60+ years | 38,729 |
| Urbanization (C 2010) | |
|---|---|
| Urban | 1,747,152 |
