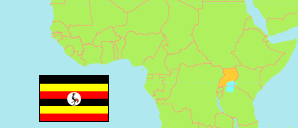
Gomba
District in Central Region
Contents: Subdivision
The population development in Gomba as well as related information and services (Wikipedia, Google, images).
| Name | Status | Population Projection 2015-07-01 | Population Projection 2020-07-01 | |
|---|---|---|---|---|
| Gomba | District | 161,700 | 173,800 | |
| Kabulasoke | Subcounty | 50,400 | 54,400 | → |
| Kanoni | Town Council | 12,600 | 13,500 | → |
| Kyegonza | Subcounty | 30,600 | 32,800 | → |
| Maddu | Subcounty | 35,800 | 38,400 | → |
| Mpenja | Subcounty | 32,300 | 34,700 | → |
| Central (Buganda) | Region | 9,780,900 | 11,562,900 |
Source: Uganda Bureau of Statistics (web).
Explanation: Districts and subcounties as operational in mid-2019. Area figures of districts are derived from spatial data. The 2020 projection does not consider the population increase by refugees from neighboring countries like South Sudan.