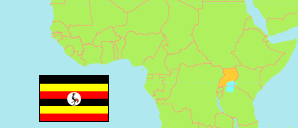
Jinja City
Uganda
Contents: Population
The population development of Jinja City as well as related information and services (Wikipedia, Google, images).
| Name | Status | Population Census 2014-08-27 | Population Census 2024-05-10 | |
|---|---|---|---|---|
| Jinja City | City | 247,074 | 279,184 | |
| Uganda | Republic | 34,634,650 | 45,905,417 |
Source: Uganda Bureau of Statistics.
Further information about the population structure:
| Gender (C 2024) | |
|---|---|
| Males | 123,031 |
| Females | 156,153 |
| Age Groups (C 2024) | |
|---|---|
| 0-14 years | 98,540 |
| 15-64 years | 172,866 |
| 65+ years | 7,778 |
