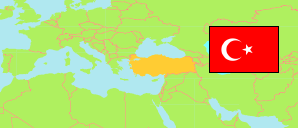
Mut
District in Turkey
Contents: Population
The population development of Mut as well as related information and services (Wikipedia, Google, images).
| Name | Status | Population Estimate 2009-12-31 | Population Estimate 2013-12-31 | Population Estimate 2017-12-31 | Population Estimate 2023-12-31 | ||||||||||||||
|---|---|---|---|---|---|---|---|---|---|---|---|---|---|---|---|---|---|---|---|
| Mut | District | 63,673 | 62,693 | 62,228 | 63,516 | ||||||||||||||
Mut 63,516 Population [2023] – Estimate 2,900 km² Area 21.90/km² Population Density [2023] 0.34% Annual Population Change [2017 → 2023] | |||||||||||||||||||
| Türkiye [Turkey] | Republic | 72,561,312 | 76,667,864 | 80,810,525 | 85,372,377 | ||||||||||||||
Source: State Institute of Statistics, Republic of Türkiye.
Explanation: Area figures of districts are computed by using geospatial data.
Further information about the population structure:
| Gender (E 2023) | |
|---|---|
| Males | 31,908 |
| Females | 31,608 |
| Age Groups (E 2023) | |
|---|---|
| 0-14 years | 12,427 |
| 15-64 years | 42,128 |
| 65+ years | 8,961 |
| Age Distribution (E 2023) | |
|---|---|
| 90+ years | 305 |
| 80-89 years | 1,687 |
| 70-79 years | 4,094 |
| 60-69 years | 6,636 |
| 50-59 years | 9,321 |
| 40-49 years | 8,981 |
| 30-39 years | 7,900 |
| 20-29 years | 7,826 |
| 10-19 years | 8,921 |
| 0-9 years | 7,845 |
