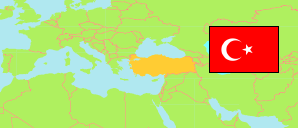
Sivas
Province in Turkey
Contents: Subdivision
The population development in Sivas as well as related information and services (Wikipedia, Google, images).
| Name | Status | Population Estimate 2009-12-31 | Population Estimate 2013-12-31 | Population Estimate 2017-12-31 | Population Estimate 2023-12-31 | |
|---|---|---|---|---|---|---|
| Sivas | Province | 633,347 | 623,824 | 621,301 | 650,401 | |
| Akıncılar | District | 5,226 | 5,300 | 4,679 | 5,111 | → |
| Altınyayla | District | 10,341 | 9,736 | 9,645 | 8,866 | → |
| Divriği | District | 16,713 | 16,128 | 14,953 | 16,893 | → |
| Doğanşar | District | 2,939 | 2,881 | 2,678 | 3,216 | → |
| Gemerek | District | 28,718 | 26,157 | 22,338 | 22,717 | → |
| Gölova | District | 3,586 | 3,532 | 2,857 | 3,614 | → |
| Gürün | District | 21,283 | 19,954 | 18,520 | 18,118 | → |
| Hafik | District | 8,895 | 9,438 | 8,601 | 10,944 | → |
| İmranlı | District | 7,483 | 7,975 | 6,705 | 9,091 | → |
| Kangal | District | 25,907 | 23,089 | 20,864 | 21,629 | → |
| Koyulhisar | District | 12,943 | 14,274 | 11,769 | 12,959 | → |
| Merkez | District | 338,728 | 348,623 | 372,300 | 389,719 | → |
| Şarkışla | District | 41,031 | 38,094 | 37,411 | 37,758 | → |
| Suşehri | District | 28,044 | 26,053 | 24,753 | 25,295 | → |
| Ulaş | District | 10,902 | 9,584 | 8,483 | 8,879 | → |
| Yıldızeli | District | 47,228 | 40,540 | 33,486 | 31,719 | → |
| Zara | District | 23,380 | 22,466 | 21,259 | 23,873 | → |
| Türkiye [Turkey] | Republic | 72,561,312 | 76,667,864 | 80,810,525 | 85,372,377 |
Source: State Institute of Statistics, Republic of Türkiye.
Explanation: Area figures of districts are computed by using geospatial data.
Further information about the population structure:
| Gender (E 2023) | |
|---|---|
| Males | 325,125 |
| Females | 325,276 |
| Age Groups (E 2023) | |
|---|---|
| 0-14 years | 122,477 |
| 15-64 years | 436,407 |
| 65+ years | 91,517 |
| Age Distribution (E 2023) | |
|---|---|
| 90+ years | 2,612 |
| 80-89 years | 14,627 |
| 70-79 years | 42,246 |
| 60-69 years | 68,602 |
| 50-59 years | 77,792 |
| 40-49 years | 85,248 |
| 30-39 years | 84,972 |
| 20-29 years | 101,100 |
| 10-19 years | 94,793 |
| 0-9 years | 78,409 |
