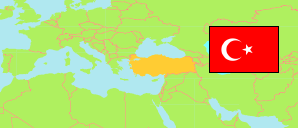
Kayseri
Metropolitan Province in Turkey
Contents: Subdivision
The population development in Kayseri as well as related information and services (Wikipedia, Google, images).
| Name | Status | Population Estimate 2009-12-31 | Population Estimate 2013-12-31 | Population Estimate 2017-12-31 | Population Estimate 2023-12-31 | |
|---|---|---|---|---|---|---|
| Kayseri | Metropolitan Province | 1,205,872 | 1,295,355 | 1,376,722 | 1,445,683 | |
| Akkışla | District | 8,120 | 6,663 | 6,018 | 6,246 | → |
| Bünyan | District | 33,704 | 29,120 | 27,045 | 30,834 | → |
| Develi | District | 65,544 | 63,994 | 64,389 | 67,918 | → |
| Felahiye | District | 7,136 | 7,013 | 5,697 | 6,550 | → |
| Hacılar | District | 12,598 | 12,376 | 12,293 | 12,979 | → |
| İncesu | District | 22,349 | 24,315 | 25,852 | 30,477 | → |
| Kocasinan | District | 366,676 | 377,051 | 393,844 | 407,600 | → |
| Melikgazi | District | 452,990 | 520,319 | 562,598 | 585,483 | → |
| Özvatan | District | 4,993 | 4,542 | 3,992 | 4,523 | → |
| Pınarbaşı | District | 30,340 | 26,559 | 23,014 | 24,172 | → |
| Sarıoğlan | District | 18,138 | 14,977 | 13,690 | 15,394 | → |
| Sarız | District | 12,290 | 10,626 | 9,335 | 11,278 | → |
| Talas | District | 87,825 | 119,810 | 155,024 | 168,172 | → |
| Tomarza | District | 27,944 | 24,996 | 22,408 | 22,041 | → |
| Yahyalı | District | 38,223 | 36,776 | 35,788 | 36,078 | → |
| Yeşilhisar | District | 17,002 | 16,218 | 15,735 | 15,938 | → |
| Türkiye [Turkey] | Republic | 72,561,312 | 76,667,864 | 80,810,525 | 85,372,377 |
Source: State Institute of Statistics, Republic of Türkiye.
Explanation: Area figures of districts are computed by using geospatial data.
Further information about the population structure:
| Gender (E 2023) | |
|---|---|
| Males | 722,569 |
| Females | 723,114 |
| Age Groups (E 2023) | |
|---|---|
| 0-14 years | 318,054 |
| 15-64 years | 983,583 |
| 65+ years | 144,046 |
| Age Distribution (E 2023) | |
|---|---|
| 90+ years | 3,502 |
| 80-89 years | 21,747 |
| 70-79 years | 65,077 |
| 60-69 years | 120,630 |
| 50-59 years | 166,295 |
| 40-49 years | 213,457 |
| 30-39 years | 207,417 |
| 20-29 years | 212,417 |
| 10-19 years | 233,235 |
| 0-9 years | 201,906 |
