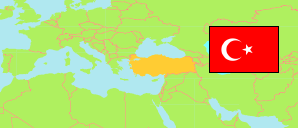
Konya
Metropolitan Province in Turkey
Contents: Subdivision
The population development in Konya as well as related information and services (Wikipedia, Google, images).
| Name | Status | Population Estimate 2009-12-31 | Population Estimate 2013-12-31 | Population Estimate 2017-12-31 | Population Estimate 2023-12-31 | |
|---|---|---|---|---|---|---|
| Konya | Metropolitan Province | 1,992,675 | 2,079,225 | 2,180,149 | 2,320,241 | |
| Ahırlı | District | 5,519 | 4,765 | 4,598 | 5,027 | → |
| Akören | District | 7,386 | 6,740 | 6,004 | 5,902 | → |
| Akşehir | District | 95,889 | 93,883 | 94,255 | 92,946 | → |
| Altınekin | District | 15,163 | 14,528 | 14,074 | 14,851 | → |
| Beyşehir | District | 70,569 | 70,297 | 72,716 | 79,030 | → |
| Bozkır | District | 32,992 | 28,152 | 25,983 | 25,885 | → |
| Çeltik | District | 11,316 | 10,396 | 9,569 | 10,324 | → |
| Cihanbeyli | District | 62,794 | 56,234 | 52,549 | 50,922 | → |
| Çumra | District | 64,996 | 64,619 | 66,019 | 68,543 | → |
| Derbent | District | 5,557 | 4,783 | 4,300 | 4,160 | → |
| Derebucak | District | 10,924 | 7,576 | 6,326 | 5,790 | → |
| Doğanhisar | District | 21,813 | 18,193 | 16,118 | 14,815 | → |
| Emirgazi | District | 10,053 | 9,324 | 8,685 | 7,945 | → |
| Ereğli | District | 135,008 | 137,837 | 143,625 | 153,849 | → |
| Güneysınır | District | 10,766 | 9,928 | 9,296 | 9,415 | → |
| Hadim | District | 14,953 | 13,572 | 11,873 | 11,459 | → |
| Halkapınar | District | 5,253 | 4,739 | 4,173 | 4,183 | → |
| Hüyük | District | 20,666 | 16,769 | 15,556 | 15,431 | → |
| Ilgın | District | 60,603 | 56,452 | 54,825 | 53,707 | → |
| Kadınhanı | District | 35,962 | 33,382 | 31,830 | 31,852 | → |
| Karapınar | District | 48,257 | 48,665 | 49,581 | 51,166 | → |
| Karatay | District | 257,639 | 286,355 | 315,959 | 375,919 | → |
| Kulu | District | 50,935 | 51,314 | 49,564 | 52,447 | → |
| Meram | District | 309,276 | 333,988 | 345,813 | 347,341 | → |
| Sarayönü | District | 30,209 | 27,059 | 26,522 | 28,967 | → |
| Selçuklu | District | 487,899 | 565,093 | 639,450 | 695,771 | → |
| Seydişehir | District | 64,344 | 63,628 | 64,894 | 65,928 | → |
| Taşkent | District | 7,879 | 7,094 | 6,036 | 6,976 | → |
| Tuzlukçu | District | 7,904 | 7,111 | 6,544 | 6,546 | → |
| Yalıhüyük | District | 1,882 | 1,830 | 1,533 | 1,854 | → |
| Yunak | District | 28,269 | 24,919 | 21,879 | 21,290 | → |
| Türkiye [Turkey] | Republic | 72,561,312 | 76,667,864 | 80,810,525 | 85,372,377 |
Source: State Institute of Statistics, Republic of Türkiye.
Explanation: Area figures of districts are computed by using geospatial data.
Further information about the population structure:
| Gender (E 2023) | |
|---|---|
| Males | 1,152,384 |
| Females | 1,167,857 |
| Age Groups (E 2023) | |
|---|---|
| 0-14 years | 518,613 |
| 15-64 years | 1,559,769 |
| 65+ years | 241,859 |
| Age Distribution (E 2023) | |
|---|---|
| 90+ years | 5,734 |
| 80-89 years | 36,629 |
| 70-79 years | 110,951 |
| 60-69 years | 198,555 |
| 50-59 years | 261,637 |
| 40-49 years | 314,691 |
| 30-39 years | 322,838 |
| 20-29 years | 362,879 |
| 10-19 years | 368,348 |
| 0-9 years | 337,979 |
