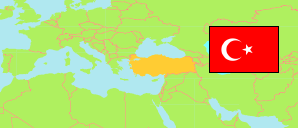
Denizli
Metropolitan Province in Turkey
Contents: Subdivision
The population development in Denizli as well as related information and services (Wikipedia, Google, images).
| Name | Status | Population Estimate 2009-12-31 | Population Estimate 2013-12-31 | Population Estimate 2017-12-31 | Population Estimate 2023-12-31 | |
|---|---|---|---|---|---|---|
| Denizli | Metropolitan Province | 926,362 | 963,464 | 1,018,735 | 1,059,082 | |
| Acıpayam | District | 58,355 | 55,971 | 55,384 | 55,406 | → |
| Babadağ | District | 7,707 | 6,707 | 6,495 | 6,424 | → |
| Baklan | District | 6,359 | 5,934 | 5,532 | 5,457 | → |
| Bekilli | District | 8,330 | 7,751 | 6,824 | 6,565 | → |
| Beyağaç | District | 7,241 | 7,116 | 6,549 | 6,532 | → |
| Bozkurt | District | 11,548 | 12,279 | 12,736 | 11,000 | → |
| Buldan | District | 27,430 | 27,558 | 27,248 | 26,542 | → |
| Çal | District | 22,649 | 20,587 | 19,254 | 17,919 | → |
| Çameli | District | 20,498 | 19,315 | 18,111 | 17,814 | → |
| Çardak | District | 9,520 | 9,386 | 8,673 | 8,781 | → |
| Çivril | District | 61,491 | 60,615 | 60,503 | 59,912 | → |
| Güney | District | 11,717 | 10,796 | 9,896 | 9,573 | → |
| Honaz | District | 30,931 | 32,324 | 33,456 | 34,237 | → |
| Kale | District | 22,044 | 21,293 | 20,262 | 19,388 | → |
| Merkezefendi | District | ... | 262,825 | 295,699 | 340,400 | → |
| Pamukkale | District | ... | 311,496 | 343,290 | 346,047 | → |
| Sarayköy | District | 30,031 | 29,650 | 30,462 | 31,047 | → |
| Serinhisar | District | 15,438 | 14,817 | 14,488 | 14,591 | → |
| Tavas | District | 51,644 | 47,044 | 43,873 | 41,447 | → |
| Türkiye [Turkey] | Republic | 72,561,312 | 76,667,864 | 80,810,525 | 85,372,377 |
Source: State Institute of Statistics, Republic of Türkiye.
Explanation: Area figures of districts are computed by using geospatial data.
Further information about the population structure:
| Gender (E 2023) | |
|---|---|
| Males | 526,717 |
| Females | 532,365 |
| Age Groups (E 2023) | |
|---|---|
| 0-14 years | 197,749 |
| 15-64 years | 730,924 |
| 65+ years | 130,409 |
| Age Distribution (E 2023) | |
|---|---|
| 90+ years | 3,482 |
| 80-89 years | 21,312 |
| 70-79 years | 58,874 |
| 60-69 years | 105,103 |
| 50-59 years | 138,205 |
| 40-49 years | 167,035 |
| 30-39 years | 148,356 |
| 20-29 years | 146,052 |
| 10-19 years | 142,949 |
| 0-9 years | 127,714 |
