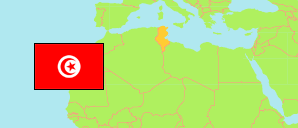
Kairouan
Governorate in Tunisia
Contents: Subdivision
The population development in Kairouan as well as related information and services (Wikipedia, Google, images).
| Name | Status | Native | Population Census 2004-04-28 | Population Census 2014-04-23 | Population Census 2024-11-06 | |
|---|---|---|---|---|---|---|
| Kairouan | Governorate | القيروان | 546,209 | 570,559 | 600,803 | |
| Abida | Municipality | عبيدة | 14,196 | 15,033 | 15,394 | → |
| Aïn Djeloula | Municipality | عين جلولة | 7,179 | 6,780 | 6,441 | → |
| Aïn El Beïdha | Municipality | العين البيضاء | 14,386 | 12,956 | 15,285 | → |
| Bou Hajla | Municipality | بوحجلة | 65,239 | 66,523 | 71,836 | → |
| Chaouachi | Municipality | الشوايحية | 11,681 | 11,440 | 14,200 | → |
| Chebika | Municipality | الشبيكة | 19,693 | 20,275 | 21,799 | → |
| Chraitia - Ksour | Municipality | الشرایطیة القصور | 10,702 | 10,412 | 11,215 | → |
| Echrarda | Municipality | الشراردة | 11,865 | 13,692 | 14,361 | → |
| El Alâa | Municipality | العلا | 31,773 | 28,991 | 28,897 | → |
| Haffouz | Municipality | حفوز | 29,406 | 27,110 | 29,207 | → |
| Hajeb El Ayoun | Municipality | حاجب العيون | 23,722 | 24,697 | 26,455 | → |
| Jehina | Municipality | جهينة | 8,686 | 9,262 | 10,090 | → |
| Kairouan | Municipality | القيروان | 141,609 | 165,761 | 172,788 | → |
| Menzel Mehiri | Municipality | منزل مهيري | 12,454 | 12,660 | 12,680 | → |
| Nasrallah | Municipality | نصر الله | 24,658 | 21,129 | 20,310 | → |
| Oueslatia | Municipality | الوسلاتية | 29,016 | 27,672 | 26,454 | → |
| Raqqada | Municipality | رقادة | 22,629 | 24,244 | 25,741 | → |
| Sbikha | Municipality | السبيخة | 39,073 | 40,206 | 42,533 | → |
| Sisseb - Driaat | Municipality | سيسب - الذريعات | 28,242 | 31,716 | 35,117 | → |
| Tunisie [Tunisia] | Republic | تونس | 9,910,872 | 10,982,754 | 11,972,169 |
Source: Institut National de la Statistique Tunisie.
Explanation: Municipalities take the 2015-17 municipal boundary reform and further changes into account. Area figures are computed using geospatial data.
Further information about the population structure:
| Gender (C 2024) | |
|---|---|
| Males | 297,238 |
| Females | 303,565 |
| Age Groups (C 2024) | |
|---|---|
| 0-14 years | 155,483 |
| 15-64 years | 379,540 |
| 65+ years | 65,780 |
| Age Distribution (C 2024) | |
|---|---|
| 80+ years | 14,995 |
| 70-79 years | 27,851 |
| 60-69 years | 51,706 |
| 50-59 years | 66,473 |
| 40-49 years | 83,521 |
| 30-39 years | 81,853 |
| 20-29 years | 70,551 |
| 10-19 years | 105,896 |
| 0-9 years | 97,957 |
