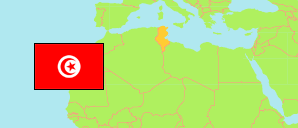
Sfax
Governorate in Tunisia
Contents: Subdivision
The population development in Sfax as well as related information and services (Wikipedia, Google, images).
| Name | Status | Native | Population Census 2004-04-28 | Population Census 2014-04-23 | Population Census 2024-11-06 | |
|---|---|---|---|---|---|---|
| Sfax | Governorate | صفاقس | 855,256 | 955,421 | 1,047,468 | |
| Agareb | Municipality | عقارب | 35,841 | 40,943 | 46,652 | → |
| Bir Ali Ben Khalifa | Municipality | بئر علي بن خليفة | 30,097 | 31,823 | 32,383 | → |
| Chihia | Municipality | الشيحية | 23,625 | 27,268 | 30,014 | → |
| El Achech | Municipality | العشاش | 15,309 | 17,804 | 20,542 | → |
| El Aïn | Municipality | العين | 38,250 | 43,333 | 44,258 | → |
| El Amra | Municipality | العامرة | ... | 30,599 | 35,808 | → |
| El Hencha | Municipality | الحنشة | ... | 32,247 | 37,041 | → |
| El Nasr | Municipality | النصر | ... | 16,976 | 18,393 | → |
| Graïba | Municipality | الغريبة | 14,647 | 15,776 | 16,678 | → |
| Gremda | Municipality | قرمدة | 36,405 | 40,862 | 49,140 | → |
| Hadjeb | Municipality | الحاجب | 11,578 | 19,455 | 26,412 | → |
| Hazeg - Ellouza | Municipality | الحزق - اللوزة | ... | 18,914 | 21,957 | → |
| Jebiniana | Municipality | جبنيانة | ... | 30,764 | 36,407 | → |
| Kerkennah | Municipality | قرقنة | 14,400 | 15,501 | 15,382 | → |
| Mahrès | Municipality | المحرس | 30,676 | 34,257 | 35,698 | → |
| Menzel Chaker | Municipality | منزل شاكر | 18,810 | 19,564 | 22,004 | → |
| Nadhour - Sidi Ali Ben Abed | Municipality | الناظور - سيدي علي بالعابد | 19,962 | 20,855 | 22,956 | → |
| Ouabed - Khazanet | Municipality | العوابد - الخزانات | 27,249 | 34,944 | 49,318 | → |
| Sakiet Eddaïer | Municipality | ساقية الدائر | 39,027 | 44,511 | 52,901 | → |
| Sakiet Ezzit | Municipality | ساقية الزيت | 48,856 | 60,244 | 66,634 | → |
| Sfax | Municipality | صفاقس | 270,917 | 280,566 | 273,506 | → |
| Skhira | Municipality | الصخيرة | 29,616 | 34,673 | 40,035 | → |
| Thyna | Municipality | طينة | 34,069 | 43,542 | 53,349 | → |
| Tunisie [Tunisia] | Republic | تونس | 9,910,872 | 10,982,754 | 11,972,169 |
Source: Institut National de la Statistique Tunisie.
Explanation: Municipalities take the 2015-17 municipal boundary reform and further changes into account. Area figures are computed using geospatial data.
Further information about the population structure:
| Gender (C 2024) | |
|---|---|
| Males | 515,659 |
| Females | 531,809 |
| Age Groups (C 2024) | |
|---|---|
| 0-14 years | 239,707 |
| 15-64 years | 687,613 |
| 65+ years | 120,148 |
| Age Distribution (C 2024) | |
|---|---|
| 80+ years | 24,735 |
| 70-79 years | 50,575 |
| 60-69 years | 105,087 |
| 50-59 years | 124,134 |
| 40-49 years | 148,350 |
| 30-39 years | 146,290 |
| 20-29 years | 129,249 |
| 10-19 years | 170,622 |
| 0-9 years | 148,426 |
