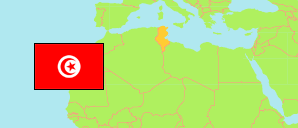
Mahdia
Governorate in Tunisia
Contents: Subdivision
The population development in Mahdia as well as related information and services (Wikipedia, Google, images).
| Name | Status | Native | Population Census 2004-04-28 | Population Census 2014-04-23 | Population Census 2024-11-06 | |
|---|---|---|---|---|---|---|
| Mahdia | Governorate | المهدية | 377,853 | 410,812 | 449,985 | |
| Bou Merdes | Municipality | بومرداس | 14,832 | 16,726 | 17,530 | → |
| Chebba | Municipality | الشابة | 27,433 | 29,282 | 31,137 | → |
| Chorbane | Municipality | شربان | 28,577 | 25,935 | 29,059 | → |
| El Bradâa | Municipality | البرادعة | 13,693 | 15,639 | 13,659 | → |
| El Hekaima | Municipality | الحكائمة | 13,232 | 13,776 | 14,152 | → |
| El Jem | Municipality | الجم | 27,545 | 32,458 | 38,413 | → |
| Essouassi | Municipality | السواسي | 27,305 | 29,324 | 34,619 | → |
| Hebira | Municipality | هبيرة | 11,057 | 10,654 | 11,617 | → |
| Kerker | Municipality | كركر | 14,727 | 17,164 | 19,559 | → |
| Ksour Essef | Municipality | قصور الساف | 31,007 | 33,960 | 38,567 | → |
| Mahdia | Municipality | المهدية | 49,553 | 55,458 | 60,352 | → |
| Melloulèche | Municipality | ملولش | 19,464 | 22,085 | 23,890 | → |
| Ouled Chamekh | Municipality | أولاد الشامخ | 22,732 | 23,020 | 23,893 | → |
| Rejiche | Municipality | رجيش | 8,934 | 10,311 | 11,603 | → |
| Sidi Alouane | Municipality | سيدي علوان | 23,737 | 25,746 | 27,654 | → |
| Sidi Zid - Awled Moulahem | Municipality | سيدي زيد - أولاد مولاهم | 18,971 | 21,100 | 24,064 | → |
| Tlelsa | Municipality | التلالسة | 13,519 | 16,153 | 17,563 | → |
| Zelba | Municipality | زالبة | 11,535 | 12,021 | 12,654 | → |
| Tunisie [Tunisia] | Republic | تونس | 9,910,872 | 10,982,754 | 11,972,169 |
Source: Institut National de la Statistique Tunisie.
Explanation: Municipalities take the 2015-17 municipal boundary reform and further changes into account. Area figures are computed using geospatial data.
Further information about the population structure:
| Gender (C 2024) | |
|---|---|
| Males | 213,709 |
| Females | 236,276 |
| Age Groups (C 2024) | |
|---|---|
| 0-14 years | 118,937 |
| 15-64 years | 281,998 |
| 65+ years | 49,050 |
| Age Distribution (C 2024) | |
|---|---|
| 80+ years | 10,320 |
| 70-79 years | 21,119 |
| 60-69 years | 39,861 |
| 50-59 years | 50,135 |
| 40-49 years | 59,406 |
| 30-39 years | 59,859 |
| 20-29 years | 53,285 |
| 10-19 years | 80,017 |
| 0-9 years | 75,983 |
