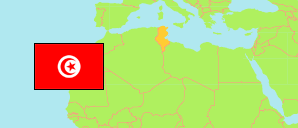
Sousse
Governorate in Tunisia
Contents: Subdivision
The population development in Sousse as well as related information and services (Wikipedia, Google, images).
| Name | Status | Native | Population Census 2004-04-28 | Population Census 2014-04-23 | Population Census 2024-11-06 | |
|---|---|---|---|---|---|---|
| Sousse | Governorate | سوسة | 544,413 | 674,971 | 762,281 | |
| Akouda | Municipality | أكودة | 21,237 | 27,200 | 30,568 | → |
| Bouficha | Municipality | بوفيشة | 23,581 | 26,763 | 36,094 | → |
| Chott Meriem | Municipality | شط مريم | 4,480 | 7,294 | 8,606 | → |
| Enfida | Municipality | النفيضة | 27,061 | 30,350 | 35,246 | → |
| Ezzouhour | Municipality | الزهور | 11,669 | 17,409 | 18,589 | → |
| Grimet - Hicher | Municipality | القريمات هيشر | 16,365 | 18,985 | 23,367 | → |
| Hammam Sousse | Municipality | حمام سوسة | 34,685 | 42,691 | 48,899 | → |
| Hergla | Municipality | هرقلة | 7,913 | 9,343 | 10,652 | → |
| Kalâa Kebira | Municipality | القلعة الكبرى | 51,196 | 59,132 | 67,108 | → |
| Kalâa Seghira | Municipality | القلعة الصغرى | 27,726 | 37,797 | 45,743 | → |
| Kondar | Municipality | كندار | 11,636 | 13,565 | 15,491 | → |
| Ksibet Thrayet | Municipality | قصيبة سوسة والثريات | 8,762 | 11,312 | 15,497 | → |
| Messaadine | Municipality | المسعدين | 8,444 | 12,930 | 14,883 | → |
| M'saken | Municipality | مساكن | 76,936 | 84,295 | 82,429 | → |
| Sidi Bou Ali | Municipality | سيدي بوعلي | 17,606 | 19,693 | 20,647 | → |
| Sidi El Hani | Municipality | سيدي الهاني | 11,614 | 13,505 | 14,508 | → |
| Sousse | Municipality | سوسة | 173,047 | 221,715 | 240,321 | → |
| Zaouiet Sousse | Municipality | زاوية سوسة | 10,455 | 20,992 | 33,633 | → |
| Tunisie [Tunisia] | Republic | تونس | 9,910,872 | 10,982,754 | 11,972,169 |
Source: Institut National de la Statistique Tunisie.
Explanation: Municipalities take the 2015-17 municipal boundary reform and further changes into account. Area figures are computed using geospatial data.
Further information about the population structure:
| Gender (C 2024) | |
|---|---|
| Males | 374,593 |
| Females | 387,688 |
| Age Groups (C 2024) | |
|---|---|
| 0-14 years | 170,526 |
| 15-64 years | 517,053 |
| 65+ years | 74,702 |
| Age Distribution (C 2024) | |
|---|---|
| 80+ years | 12,722 |
| 70-79 years | 32,207 |
| 60-69 years | 67,946 |
| 50-59 years | 85,604 |
| 40-49 years | 108,660 |
| 30-39 years | 112,811 |
| 20-29 years | 111,874 |
| 10-19 years | 126,073 |
| 0-9 years | 104,384 |
