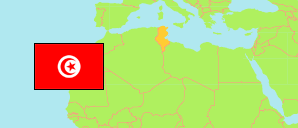
Jendouba
Governorate in Tunisia
Contents: Subdivision
The population development in Jendouba as well as related information and services (Wikipedia, Google, images).
| Name | Status | Native | Population Census 2004-04-28 | Population Census 2014-04-23 | Population Census 2024-11-06 | |
|---|---|---|---|---|---|---|
| Jendouba | Governorate | جندوبة | 416,608 | 401,477 | 404,352 | |
| Aïn Draham | Municipality | عين دراهم | 25,490 | 23,227 | 20,938 | → |
| Aïn Sobh - Nadhour | Municipality | عين الصبح - الناظور | 17,186 | 15,051 | 13,836 | → |
| Balta - Bou Aouane | Municipality | بلطة بوعوان | 34,782 | 30,268 | 27,606 | → |
| Beni M'Tir | Municipality | بني مطير | 6,901 | 5,553 | 5,239 | → |
| Bou Salem | Municipality | بوسالم | 43,508 | 43,997 | 45,959 | → |
| Fernana | Municipality | فرنانة | 26,980 | 25,398 | 28,202 | → |
| Ghardimaou | Municipality | غار الدماء | 52,295 | 50,793 | 49,612 | → |
| Jendouba | Municipality | جندوبة | 98,318 | 100,085 | 109,173 | → |
| Jouaouda | Municipality | الجواودة | 18,809 | 16,739 | 14,476 | → |
| Kalaa - Maaden - Farksan | Municipality | القلعة - المعدن - فرقصان | 15,660 | 13,377 | 12,701 | → |
| Khmairia | Municipality | الخمايرية | 14,882 | 12,173 | 11,368 | → |
| Oued Meliz | Municipality | وادي مليز | 19,015 | 17,843 | 17,334 | → |
| Souk Sebt | Municipality | سوق السبت | 14,474 | 13,031 | 12,856 | → |
| Tabarka | Municipality | طبرقة | 28,308 | 33,942 | 35,052 | → |
| Tunisie [Tunisia] | Republic | تونس | 9,910,872 | 10,982,754 | 11,972,169 |
Source: Institut National de la Statistique Tunisie.
Explanation: Municipalities take the 2015-17 municipal boundary reform and further changes into account. Area figures are computed using geospatial data.
Further information about the population structure:
| Gender (C 2024) | |
|---|---|
| Males | 198,221 |
| Females | 206,131 |
| Age Groups (C 2024) | |
|---|---|
| 0-14 years | 84,196 |
| 15-64 years | 258,002 |
| 65+ years | 62,154 |
| Age Distribution (C 2024) | |
|---|---|
| 80+ years | 13,416 |
| 70-79 years | 26,925 |
| 60-69 years | 48,085 |
| 50-59 years | 53,131 |
| 40-49 years | 56,651 |
| 30-39 years | 50,694 |
| 20-29 years | 42,519 |
| 10-19 years | 60,861 |
| 0-9 years | 52,070 |
