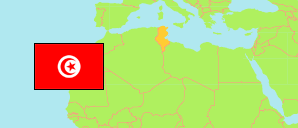
Hammam Sousse
Delegation in Tunisia
Contents: Population
The population development of Hammam Sousse as well as related information and services (Wikipedia, Google, images).
| Name | Status | Native | Population Census 2004-04-28 | Population Census 2014-04-23 | Population Census 2024-11-06 | ||||||||||||||
|---|---|---|---|---|---|---|---|---|---|---|---|---|---|---|---|---|---|---|---|
| Hammam Sousse | Delegation | حمام سوسة | 34,685 | 42,691 | 48,899 | ||||||||||||||
Hammam Sousse 48,899 Population [2024] – Census 18.47 km² Area 2,647/km² Population Density [2024] 1.3% Annual Population Change [2014 → 2024] | |||||||||||||||||||
| Tunisie [Tunisia] | Republic | تونس | 9,910,872 | 10,982,754 | 11,972,169 | ||||||||||||||
Source: Institut National de la Statistique Tunisie.
Explanation: Area figures are computed using geospatial data.
Further information about the population structure:
| Gender (C 2024) | |
|---|---|
| Males | 23,484 |
| Females | 25,415 |
| Age Groups (C 2024) | |
|---|---|
| 0-14 years | 8,731 |
| 15-64 years | 34,546 |
| 65+ years | 5,622 |
| Age Distribution (C 2024) | |
|---|---|
| 80+ years | 902 |
| 70-79 years | 2,506 |
| 60-69 years | 5,209 |
| 50-59 years | 6,205 |
| 40-49 years | 7,410 |
| 30-39 years | 6,915 |
| 20-29 years | 7,257 |
| 10-19 years | 7,441 |
| 0-9 years | 5,054 |
