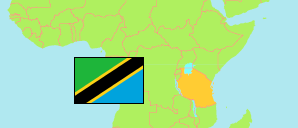
Ruangwa
District in Coastal Tanzania
Contents: Subdivision
The population in Ruangwa as well as related information and services (Wikipedia, Google, images).
| Name | Status | Population Census 2022-08-23 | |
|---|---|---|---|
| Ruangwa | District | 185,573 | |
| Chibula | Rural Ward | 4,056 | → |
| Chienjele | Rural Ward | 11,824 | → |
| Chinongwe | Rural Ward | 9,356 | → |
| Chunyu | Rural Ward | 7,638 | → |
| Likunja | Rural Ward | 10,977 | → |
| Luchelegwa | Rural Ward | 5,558 | → |
| Makanjiro | Rural Ward | 4,002 | → |
| Malolo | Rural Ward | 9,994 | → |
| Mandarawe | Rural Ward | 4,613 | → |
| Mandawa | Rural Ward | 9,868 | → |
| Matambarale | Rural Ward | 7,511 | → |
| Mbekenyera | Mixed Ward | 16,531 | → |
| Mbwemkuru (Machang'anja) | Rural Ward | 5,052 | → |
| Mnacho | Rural Ward | 8,261 | → |
| Nachingwea | Mixed Ward | 18,343 | → |
| Nambilaje (Nambilanje) | Rural Ward | 10,687 | → |
| Namichiga | Rural Ward | 7,129 | → |
| Nandagala | Rural Ward | 7,391 | → |
| Nanganga | Rural Ward | 6,671 | → |
| Narung'ombe | Rural Ward | 6,151 | → |
| Nkowe | Mixed Ward | 6,403 | → |
| Ruangwa | Mixed Ward | 7,557 | → |
| Coastal | Zone | 13,434,754 |
Source: National Bureau of Statistics Tanzania.
Explanation: Area figures are derived from geospatial data.