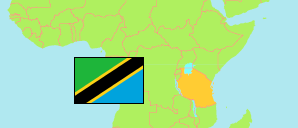
Muleba
District in Tanzania
Contents: Population
The population development of Muleba as well as related information and services (Wikipedia, Google, images).
| Name | Status | Population Census 1988-08-27 | Population Census 2002-08-01 | Population Census 2012-08-26 | Population Census 2022-08-23 | |
|---|---|---|---|---|---|---|
| Muleba | District | 273,329 | 385,184 | 540,310 | 637,659 | |
| Tanzania | United Republic | 23,174,336 | 34,443,603 | 44,928,923 | 61,741,120 |
Source: National Bureau of Statistics Tanzania.
Explanation: Area figures of districts are calculated from geospatial data.
Further information about the population structure:
| Gender (C 2022) | |
|---|---|
| Males | 315,073 |
| Females | 322,586 |
| Urbanization (C 2022) | |
|---|---|
| Rural | 605,573 |
| Urban | 32,086 |
| Age Groups (C 2022) | |
|---|---|
| 0-14 years | 276,223 |
| 15-64 years | 337,478 |
| 65+ years | 23,958 |
| Age Distribution (C 2022) | |
|---|---|
| 80+ years | 6,537 |
| 70-79 years | 9,685 |
| 60-69 years | 20,230 |
| 50-59 years | 34,255 |
| 40-49 years | 56,713 |
| 30-39 years | 69,091 |
| 20-29 years | 95,818 |
| 10-19 years | 161,442 |
| 0-9 years | 183,888 |