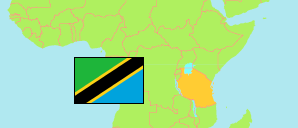
Tanga
Region in Tanzania
Contents: Subdivision
The population development in Tanga as well as related information and services (Wikipedia, Google, images).
| Name | Status | Population Census 1988-08-27 | Population Census 2002-08-01 | Population Census 2012-08-26 | Population Census 2022-08-23 | |
|---|---|---|---|---|---|---|
| Tanga | Region | 1,280,212 | 1,636,280 | 2,045,205 | 2,615,597 | |
| Bumbuli (← Lushoto) | District | ... | ... | 160,005 | 159,373 | → |
| Handeni Rural | District | ... | ... | 276,646 | 384,353 | → |
| Handeni Town | Town | ... | ... | 79,056 | 108,968 | → |
| Kilindi | District | 88,666 | 143,792 | 236,833 | 398,391 | → |
| Korogwe Rural | District | ... | ... | 242,038 | 272,870 | → |
| Korogwe Town | Town | ... | ... | 68,308 | 86,551 | → |
| Lushoto | District | ... | ... | 332,436 | 350,958 | → |
| Mkinga | District | ... | ... | 118,065 | 146,802 | → |
| Muheza | District | ... | ... | 204,461 | 238,260 | → |
| Pangani | District | 37,670 | 43,920 | 54,025 | 75,642 | → |
| Tanga City | City | 186,818 | 242,640 | 273,332 | 393,429 | → |
| Tanzania | United Republic | 23,174,336 | 34,443,603 | 44,928,923 | 61,741,120 |
Source: National Bureau of Statistics Tanzania.
Explanation: Area figures of districts are calculated from geospatial data.
Further information about the population structure:
| Gender (C 2022) | |
|---|---|
| Males | 1,275,665 |
| Females | 1,339,932 |
| Urbanization (C 2022) | |
|---|---|
| Rural | 1,936,368 |
| Urban | 679,229 |
| Age Groups (C 2022) | |
|---|---|
| 0-14 years | 1,094,439 |
| 15-64 years | 1,386,619 |
| 65+ years | 134,539 |
| Age Distribution (C 2022) | |
|---|---|
| 80+ years | 37,094 |
| 70-79 years | 57,559 |
| 60-69 years | 102,904 |
| 50-59 years | 163,902 |
| 40-49 years | 232,741 |
| 30-39 years | 289,963 |
| 20-29 years | 381,711 |
| 10-19 years | 602,270 |
| 0-9 years | 747,453 |