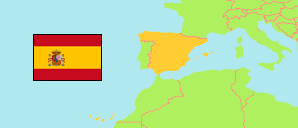
Comunitat Valenciana
Autonomous Community in Spain
Contents: Subdivision
The population development in Comunitat Valenciana as well as related information and services (Wikipedia, Google, images).
| Name | Status | Population Census 1981-03-01 | Population Census 1991-03-01 | Population Census 2001-11-01 | Population Census 2011-11-01 | Population Census 2021-01-01 | Population Evaluation 2024-01-01 | |
|---|---|---|---|---|---|---|---|---|
| Comunitat Valenciana (Comunidad Valenciana) [Valencian Community] | Autonomous Community | 3,646,778 | 3,857,234 | 4,162,776 | 5,009,930 | 5,067,911 | 5,319,285 | |
| Alicante (Alacant) | Province | 1,149,181 | 1,292,563 | 1,461,925 | 1,852,162 | 1,887,036 | 1,993,289 | → |
| Castellón (Castelló) | Province | 431,267 | 446,275 | 484,566 | 594,423 | 587,632 | 615,188 | → |
| Valencia (València) | Province | 2,066,330 | 2,118,396 | 2,216,285 | 2,563,345 | 2,593,243 | 2,710,808 | → |
| España [Spain] | Kingdom | 37,682,355 | 38,872,268 | 40,847,371 | 46,815,916 | 47,400,798 | 48,619,695 |
Source: Instituto Nacional de Estadística, Madrid.
Explanation: The latest population figures are based on an evaluation of registers.
Further information about the population structure:
| Gender (R 2024) | |
|---|---|
| Males | 2,615,852 |
| Females | 2,703,433 |
| Age Groups (R 2024) | |
|---|---|
| 0-17 years | 894,886 |
| 18-64 years | 3,350,360 |
| 65+ years | 1,074,039 |
| Age Distribution (R 2024) | |
|---|---|
| 90+ years | 57,540 |
| 80-89 years | 243,311 |
| 70-79 years | 471,975 |
| 60-69 years | 655,595 |
| 50-59 years | 820,751 |
| 40-49 years | 854,861 |
| 30-39 years | 636,976 |
| 20-29 years | 566,805 |
| 10-19 years | 574,654 |
| 0-9 years | 436,817 |
| Citizenship (R 2024) | |
|---|---|
| Spain | 4,349,683 |
| EU | 291,665 |
| Europe (Rest) | 195,839 |
| Africa | 149,323 |
| America | 269,060 |
| Asia and Oceania | 63,120 |
| Country of Birth (R 2024) | |
|---|---|
| Spain | 4,121,886 |
| EU | 272,380 |
| Europe (Rest) | 207,296 |
| Africa | 175,283 |
| America | 474,668 |
| Asia and Oceania | 67,772 |
