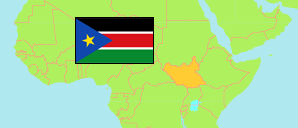
Central Equatoria
State in South Sudan
Contents: Subdivision
The population development in Central Equatoria as well as related information and services (Wikipedia, Google, images).
| Name | Status | Population Census 2008-04-22 | Population Projection 2017-07-01 | |
|---|---|---|---|---|
| Central Equatoria | State | 1,103,557 | 1,574,711 | |
| Juba | County | 368,436 | 525,953 | → |
| Kajo-Keji | County | 196,387 | 280,299 | → |
| Lainya | County | 89,315 | 127,552 | → |
| Morobo | County | 103,603 | 148,023 | → |
| Terekeka | County | 144,373 | 206,287 | → |
| Yei | County | 201,443 | 288,172 | → |
Source: South Sudan National Bureau of Statistics (web).
Explanation: The population projection does not consider migration and displacement since 2008.
Further information about the population structure:
| Gender (C 2008) | |
|---|---|
| Males | 581,722 |
| Females | 521,835 |
| Age Groups (C 2008) | |
|---|---|
| 0-14 years | 463,463 |
| 15-64 years | 620,089 |
| 65+ years | 20,005 |
| Age Distribution (C 2008) | |
|---|---|
| 0-9 years | 325,121 |
| 10-19 years | 266,906 |
| 20-29 years | 218,226 |
| 30-39 years | 141,601 |
| 40-49 years | 79,430 |
| 50-59 years | 39,002 |
| 60-69 years | 33,271 |
