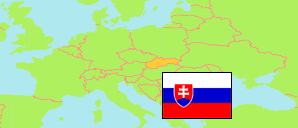
Mojš
in Žilina (Žilinský kraj)
Contents: Municipality
The population development of Mojš as well as related information and services (weather, Wikipedia, Google, images).
| Name | District | Population Census 1991-03-03 | Population Census 2001-05-26 | Population Census 2011-05-21 | Population Census 2021-01-01 | Population Estimate 2023-12-31 | |
|---|---|---|---|---|---|---|---|
| Mojš | Žilina | 524 | 474 | 662 | 1,311 | 1,450 | → |
Source: Statistical Office of the Slovak Republic.
Further information about the population structure:
| Gender (E 2023) | |
|---|---|
| Males | 739 |
| Females | 711 |
| Age Groups (E 2023) | |
|---|---|
| 0-17 years | 380 |
| 18-64 years | 936 |
| 65+ years | 134 |
| Age Distribution (E 2023) | |
|---|---|
| 90+ years | 5 |
| 80-89 years | 20 |
| 70-79 years | 51 |
| 60-69 years | 116 |
| 50-59 years | 176 |
| 40-49 years | 287 |
| 30-39 years | 256 |
| 20-29 years | 131 |
| 10-19 years | 175 |
| 0-9 years | 233 |
| Urbanization (C 2021) | |
|---|---|
| Rural | 1,311 |
| Citizenship (C 2021) | |
|---|---|
| Slovakia | 1,302 |
| Foreign Citizenship | 9 |
| Country of Birth (C 2021) | |
|---|---|
| Slovakia | 1,278 |
| Other country | 32 |
| Ethnic Group (C 2021) | |
|---|---|
| Slovak | 1,260 |
| Hungarian | 1 |
| Czech | 7 |
| Other ethnic groups | 5 |
| Mother Tongue (C 2021) | |
|---|---|
| Slovak | 1,256 |
| Hungarian | 1 |
| Czech | 8 |
| Other language | 9 |
| Religion (C 2021) | |
|---|---|
| Roman Catholic | 907 |
| Evangelical Church | 15 |
| Greek Catholic | 8 |
| Reformed (Calvinists) | 1 |
| Orthodox | 1 |
| Other christian church | 4 |
| Other religion | 20 |
| No religion | 312 |