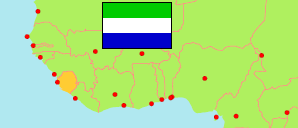
Falaba
District in Sierra Leone
Contents: Subdivision
The population development in Falaba as well as related information and services (Wikipedia, Google, images).
| Name | Status | Population Census 2004-12-04 | Population Census 2015-12-04 | Population Census 2021-12-09 | |
|---|---|---|---|---|---|
| Falaba | District | 130,753 | 205,353 | 166,205 | |
| Delemandugu | Chiefdom | ... | 21,013 | 16,189 | → |
| Dembelia | Chiefdom | ... | 10,228 | 11,822 | → |
| Dembelia-Sinkunia | Chiefdom | 13,921 | 21,449 | 15,645 | → |
| Folosaba | Chiefdom | ... | 10,691 | 6,550 | → |
| Kamadu Yiraia | Chiefdom | ... | 13,230 | 11,870 | → |
| Kebelia | Chiefdom | ... | 8,972 | 6,954 | → |
| Kulor Saradu | Chiefdom | ... | 12,375 | 9,522 | → |
| Mongo | Chiefdom | ... | 15,521 | 11,643 | → |
| Morifindugu | Chiefdom | ... | 11,302 | 13,165 | → |
| Neya | Chiefdom | ... | 25,239 | 17,960 | → |
| Nyedu | Chiefdom | ... | 5,090 | 6,716 | → |
| Sulima | Chiefdom | ... | 26,667 | 22,890 | → |
| Wollay Barawa | Chiefdom | ... | 23,576 | 15,279 | → |
| Sierra Leone | Republic | 4,976,871 | 7,092,113 | 7,548,702 |
Source: Statistics Sierra Leone (web).
Explanation: Boundaries of districts and chiefdoms according to the administrative reorganization of 2017. The 2021 census is a mid-term census. The reasons for the significant differences between the 2015 and 2021 figures are unclear. Area figures are derived from geospatial data.