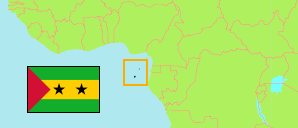
Lembá
District in São Tomé and Príncipe
Contents: Population
The population development of Lembá as well as related information and services (Wikipedia, Google, images).
| Name | Status | Population Census 1981-08-15 | Population Census 1991-08-04 | Population Census 2001-08-25 | Population Census 2012-05-13 | Population Projection 2020-05-13 | |
|---|---|---|---|---|---|---|---|
| Lembá | District | 7,905 | 9,016 | 10,696 | 14,676 | 16,940 | |
| São Tomé e Príncipe [São Tomé and Príncipe] | Republic | 96,611 | 117,504 | 137,599 | 179,200 | 210,239 |
Source: Instituto Nacional de Estatística, República Democrática de São Tomé e Príncipe (web).
Further information about the population structure:
| Gender (P 2020) | |
|---|---|
| Males | 11,625 |
| Females | 11,291 |
| Age Groups (C 2012) | |
|---|---|
| 0-14 years | 8,324 |
| 15-64 years | 10,326 |
| 65+ years | 709 |
| Citizenship (C 2012) | |
|---|---|
| São Tomé and Príncipe | 18,747 |
| São Tomé and Príncipe plus other | 271 |
| Other Citizenship | 341 |
| Spoken Language(s) (A1+) (C 2012) | |
|---|---|
| Portuguese | 18,317 |
| Forro Creole | 7,493 |
| Lunguyê (Principense Creole) | 87 |
| Angolar Creole | 413 |
| Cape Verdean Creole | 3,279 |
| French | 692 |
| English | 409 |
| Other language | 233 |
| Religion (C 2012) | |
|---|---|
| Catholic | 12,219 |
| Other religion | 3,760 |
| No religion | 3,380 |
| Literacy (A5+) (C 2012) | |
|---|---|
| Yes | 13,765 |
| Only reading | 31 |
| No | 2,343 |