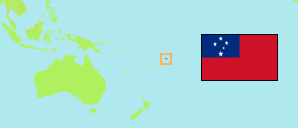
Siufaga
Village in Samoa
Contents: Population
The population development of Siufaga as well as related information and services (Wikipedia, Google, images).
| Name | Status | Population Census 2011-11-07 | Population Census 2016-11-07 | Population Census 2021-11-06 | |
|---|---|---|---|---|---|
| Siufaga | Village | 560 | 639 | 695 | |
| Samoa | Independent State | 187,820 | 195,979 | 205,557 |
Source: Samoa Statistical Services Division (web).
Explanation: Electoral constituencies as defined in 2019. The boundaries are derived from 2011 enumeration areas and may slighty differ from the actual demarcation (especially in uninhabitated areas).
Further information about the population structure:
| Gender (C 2021) | |
|---|---|
| Males | 367 |
| Females | 328 |
| Age Groups (C 2021) | |
|---|---|
| 0-14 years | 289 |
| 15-64 years | 354 |
| 65+ years | 51 |
| Age Distribution (C 2021) | |
|---|---|
| 90+ years | 1 |
| 80-89 years | 8 |
| 70-79 years | 19 |
| 60-69 years | 38 |
| 50-59 years | 48 |
| 40-49 years | 85 |
| 30-39 years | 75 |
| 20-29 years | 80 |
| 10-19 years | 139 |
| 0-9 years | 201 |
| Citizenship (C 2021) | |
|---|---|
| Samoa | 694 |
| Foreign Citizenship | 1 |
| Religion (C 2021) | |
|---|---|
| Congregational Christian Church of Samoa | 221 |
| Methodist | 1 |
| Roman Catholic | 219 |
| Latter Day Saints | 176 |
| Assembly of God | 59 |
| Other religion | 19 |