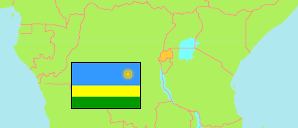
Burera
District in Rwanda
Contents: Subdivision
The population development in Burera as well as related information and services (Wikipedia, Google, images).
| Name | Status | Population Census 2012-08-15 | Population Census 2022-08-15 | |
|---|---|---|---|---|
| Burera | District | 336,582 | 387,729 | |
| Bungwe | Sector | 14,774 | 16,322 | → |
| Butaro | Sector | 31,520 | 38,013 | → |
| Cyanika | Sector | 37,618 | 44,510 | → |
| Cyeru | Sector | 12,783 | 14,719 | → |
| Gahunga | Sector | 25,637 | 28,059 | → |
| Gatebe | Sector | 16,556 | 18,867 | → |
| Gitovu | Sector | 10,390 | 11,531 | → |
| Kagogo | Sector | 19,281 | 23,089 | → |
| Kinoni | Sector | 17,523 | 19,017 | → |
| Kinyababa | Sector | 20,802 | 23,746 | → |
| Kivuye | Sector | 15,448 | 18,057 | → |
| Nemba | Sector | 18,088 | 21,401 | → |
| Rugarama | Sector | 24,014 | 27,051 | → |
| Rugengabari | Sector | 18,467 | 20,920 | → |
| Ruhunde | Sector | 16,975 | 20,157 | → |
| Rusarabuye | Sector | 18,396 | 20,659 | → |
| Rwerere | Sector | 18,310 | 21,611 | → |
| Rwanda | Republic | 10,515,973 | 13,246,394 |
Source: National Institute of Statistics Rwanda.
Further information about the population structure:
| Gender (C 2022) | |
|---|---|
| Males | 184,782 |
| Females | 202,947 |
| Age Groups (C 2022) | |
|---|---|
| 0-14 years | 145,502 |
| 15-64 years | 223,953 |
| 65+ years | 18,274 |
| Age Distribution (C 2022) | |
|---|---|
| 80+ years | 4,094 |
| 70-79 years | 7,538 |
| 60-69 years | 15,756 |
| 50-59 years | 19,329 |
| 40-49 years | 30,584 |
| 30-39 years | 48,219 |
| 20-29 years | 68,088 |
| 10-19 years | 93,617 |
| 0-9 years | 100,504 |
| Urbanization (C 2022) | |
|---|---|
| Rural | 349,287 |
| Urban | 38,442 |