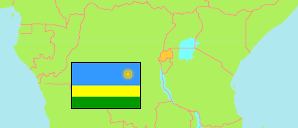
Muhanga
District in Rwanda
Contents: Subdivision
The population development in Muhanga as well as related information and services (Wikipedia, Google, images).
| Name | Status | Population Census 2012-08-15 | Population Census 2022-08-15 | |
|---|---|---|---|---|
| Muhanga | District | 319,141 | 358,433 | |
| Cyeza | Sector | 30,209 | 34,540 | → |
| Kabacuzi | Sector | 25,440 | 28,192 | → |
| Kibangu | Sector | 20,028 | 20,326 | → |
| Kiyumba | Sector | 21,766 | 23,364 | → |
| Muhanga | Sector | 25,819 | 28,700 | → |
| Mushishiro | Sector | 20,200 | 21,071 | → |
| Nyabinoni | Sector | 16,780 | 16,253 | → |
| Nyamabuye | Sector | 44,645 | 59,961 | → |
| Nyarusange | Sector | 25,712 | 28,308 | → |
| Rongi | Sector | 26,851 | 29,389 | → |
| Rugendabari | Sector | 16,920 | 17,363 | → |
| Shyogwe | Sector | 44,771 | 50,966 | → |
| Rwanda | Republic | 10,515,973 | 13,246,394 |
Source: National Institute of Statistics Rwanda.
Further information about the population structure:
| Gender (C 2022) | |
|---|---|
| Males | 173,615 |
| Females | 184,818 |
| Age Groups (C 2022) | |
|---|---|
| 0-14 years | 123,178 |
| 15-64 years | 215,786 |
| 65+ years | 19,469 |
| Age Distribution (C 2022) | |
|---|---|
| 80+ years | 4,082 |
| 70-79 years | 7,579 |
| 60-69 years | 18,642 |
| 50-59 years | 24,076 |
| 40-49 years | 37,628 |
| 30-39 years | 49,247 |
| 20-29 years | 54,853 |
| 10-19 years | 78,607 |
| 0-9 years | 83,719 |
| Urbanization (C 2022) | |
|---|---|
| Rural | 271,181 |
| Urban | 87,252 |