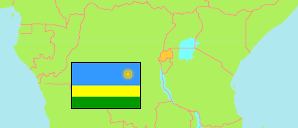
Nyamagabe
District in Rwanda
Contents: Population
The population development of Nyamagabe as well as related information and services (Wikipedia, Google, images).
| Name | Status | Population Census 2002-08-16 | Population Census 2012-08-15 | Population Census 2022-08-15 | |
|---|---|---|---|---|---|
| Nyamagabe | District | 280,007 | 341,491 | 371,501 | |
| Rwanda | Republic | 8,128,553 | 10,515,973 | 13,246,394 |
Source: National Institute of Statistics Rwanda.
Further information about the population structure:
| Gender (C 2022) | |
|---|---|
| Males | 176,725 |
| Females | 194,776 |
| Age Groups (C 2022) | |
|---|---|
| 0-14 years | 133,384 |
| 15-64 years | 214,973 |
| 65+ years | 19,062 |
| Age Distribution (C 2022) | |
|---|---|
| 80+ years | 3,867 |
| 70-79 years | 7,772 |
| 60-69 years | 18,746 |
| 50-59 years | 23,415 |
| 40-49 years | 32,304 |
| 30-39 years | 45,805 |
| 20-29 years | 57,523 |
| 10-19 years | 89,986 |
| 0-9 years | 88,001 |
| Urbanization (C 2022) | |
|---|---|
| Rural | 330,909 |
| Urban | 40,592 |
| Citizenship (C 2022) | |
|---|---|
| Rwanda | 364,758 |
| Foreign Citizenship | 6,743 |
| Literacy (A15+) (C 2022) | |
|---|---|
| yes | 174,500 |
| no | 63,600 |