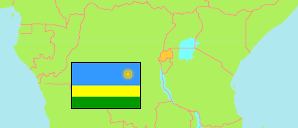
Nyagatare
District in Rwanda
Contents: Population
The population development of Nyagatare as well as related information and services (Wikipedia, Google, images).
| Name | Status | Population Census 2002-08-16 | Population Census 2012-08-15 | Population Census 2022-08-15 | |
|---|---|---|---|---|---|
| Nyagatare | District | 255,104 | 465,855 | 653,861 | |
| Rwanda | Republic | 8,128,553 | 10,515,973 | 13,246,394 |
Source: National Institute of Statistics Rwanda.
Further information about the population structure:
| Gender (C 2022) | |
|---|---|
| Males | 318,740 |
| Females | 335,121 |
| Age Groups (C 2022) | |
|---|---|
| 0-14 years | 262,655 |
| 15-64 years | 368,501 |
| 65+ years | 22,705 |
| Age Distribution (C 2022) | |
|---|---|
| 80+ years | 4,897 |
| 70-79 years | 9,210 |
| 60-69 years | 22,485 |
| 50-59 years | 33,807 |
| 40-49 years | 54,857 |
| 30-39 years | 80,840 |
| 20-29 years | 106,693 |
| 10-19 years | 157,747 |
| 0-9 years | 183,325 |
| Urbanization (C 2022) | |
|---|---|
| Rural | 495,967 |
| Urban | 157,894 |
| Citizenship (C 2022) | |
|---|---|
| Rwanda | 652,420 |
| Foreign Citizenship | 1,441 |
| Literacy (A15+) (C 2022) | |
|---|---|
| yes | 304,000 |
| no | 87,200 |