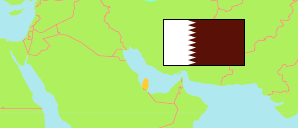
Al-Khawr & Adh-Dhakhīrah
Municipality in Qatar
Contents: Subdivision
The population development in Al-Khawr & Adh-Dhakhīrah as well as related information and services (Wikipedia, Google, images).
| Name | Status | Native | Population Census 1986-03-16 | Population Census 1997-03-01 | Population Census 2004-03-16 | Population Census 2010-04-20 | Population Census 2015-04-20 | Population Census 2020-12-31 | |
|---|---|---|---|---|---|---|---|---|---|
| Al-Khawr & Adh-Dhakhīrah [Al Khor] | Municipality | الخور والذخيرة | 9,968 | 19,053 | 32,963 | 195,182 | 202,031 | 140,453 | |
| Adh-Dhakhīrah / Rās Lafān / Umm Birkah [Al Thakhira / Rass Laffan / Umm Birka] | Zone 75 | الذخيرة / راس لفان / ام بركة | 1,932 | 7,534 | 10,524 | 129,773 | 100,118 | 42,662 | → |
| Al-Ghuwaīriyah [Al Ghuwairiya] | Zone 76 | الغويرية | 1,629 | 1,716 | 2,159 | 4,834 | 5,744 | 6,206 | → |
| Simaīsmah / Al-Jiryān / Al-Khawr [Simaisma / Al Jeryan / Al Khor] | Zone 74 | سميسمة / الجريان / الخور | 6,407 | 9,803 | 20,280 | 60,575 | 96,169 | 91,585 | → |
| Qaṭar [Qatar] | State | قطر | 369,078 | 522,023 | 744,029 | 1,699,435 | 2,404,776 | 2,846,118 |
Source: Qatar Planning and Statistics Authority (web).
Explanation: Zones as defined for the 2020 census. Older population figures may not consider boundary changes of zones. Thus, slight discrepancies are possible.
Further information about the population structure:
| Gender (C 2020) | |
|---|---|
| Males | 112,943 |
| Females | 27,510 |
| Age Groups (C 2015) | |
|---|---|
| 0-14 years | 12,100 |
| 15-64 years | 189,039 |
| 65+ years | 892 |
| Age Distribution (C 2015) | |
|---|---|
| 0-9 years | 8,819 |
| 10-19 years | 7,014 |
| 20-29 years | 62,781 |
| 30-39 years | 70,247 |
| 40-49 years | 38,311 |
| 50-59 years | 12,518 |
| 60-69 years | 1,923 |
| 70-79 years | 283 |
| 80+ years | 135 |