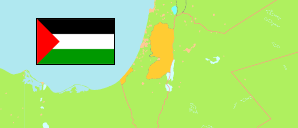
Ad-Daffah al-Gharbiyah
Territory in Palestinian Territories
Contents: Subdivision
The population development in Ad-Daffah al-Gharbiyah as well as related information and services (Wikipedia, Google, images).
| Name | Status | Native | Population Census 1997-12-10 | Population Census 2007-12-01 | Population Census 2017-12-01 | Population Projection 2023-07-01 | |
|---|---|---|---|---|---|---|---|
| Ad-Daffah al-Gharbiyah [West Bank] | Territory | الضفة الغربية | 1,873,476 | 2,350,583 | 2,881,957 | 3,256,906 | |
| Al-Khalil [Hebron] | Governorate | الخليل | 405,664 | 552,164 | 711,223 | 822,435 | → |
| Al-Quds [Jerusalem] | Governorate | القدس | 328,601 | 363,649 | 435,753 | 492,340 | → |
| Ariha [Jericho] | Governorate | أريحا والأغوار | 32,713 | 42,320 | 50,002 | 55,268 | → |
| Bayt Lahm [Bethlehem] | Governorate | بيت لحم | 137,286 | 176,235 | 217,400 | 244,704 | → |
| Janin [Jenin] | Governorate | جنين | 203,026 | 256,619 | 314,866 | 352,875 | → |
| Nabulus [Nablus] | Governorate | نابلس | 261,340 | 320,830 | 388,321 | 431,584 | → |
| Qalqilyah | Governorate | قلقيلية | 72,007 | 91,217 | 112,400 | 127,025 | → |
| Ram Allah & Al-Birah [Ramallah] | Governorate | رام الله والبيرة | 213,582 | 279,730 | 328,861 | 370,030 | → |
| Salfit | Governorate | سلفيت | 48,538 | 59,570 | 75,444 | 85,920 | → |
| Tubas | Governorate | طوباس والأغوار الشمالية | 36,609 | 50,261 | 60,927 | 68,779 | → |
| Tulkarm | Governorate | طولكرم | 134,110 | 157,988 | 186,760 | 205,946 | → |
| Al-Arāḍī al-Filasṭīniyya [Palestinian Territories] | الضفة الغربية وقطاع غزة | 2,895,683 | 3,767,126 | 4,781,248 | 5,483,450 |
Source: Palestinian Central Bureau of Statistics.
Explanation: The presented population figures include Arabs in those parts of East Jerusalem which are annexed by Israel. They do not include the Israelian settlers in the West Bank. Area figures and the map presentation include also areas that are not administered by the Palestinian National Authority.
Further information about the population structure:
| Gender (C 2017) | |
|---|---|
| Males | 1,443,624 |
| Females | 1,386,914 |
| Age Groups (C 2017) | |
|---|---|
| 0-14 years | 1,033,550 |
| 15-64 years | 1,666,004 |
| 65+ years | 99,747 |
| Age Distribution (C 2017) | |
|---|---|
| 90+ years | 3,017 |
| 80-89 years | 16,915 |
| 70-79 years | 42,879 |
| 60-69 years | 89,632 |
| 50-59 years | 182,578 |
| 40-49 years | 267,258 |
| 30-39 years | 343,508 |
| 20-29 years | 521,912 |
| 10-19 years | 614,804 |
| 0-9 years | 716,798 |
| Religion (C 2017) | |
|---|---|
| Muslim | 2,744,190 |
| Christian | 45,712 |
| Other religion | 1,124 |
| Refugee Status (C 2017) | |
|---|---|
| Not refugee | 2,049,782 |
| Registered refugee | 2,823,633 |
| Non-registered refugee | 32,403 |